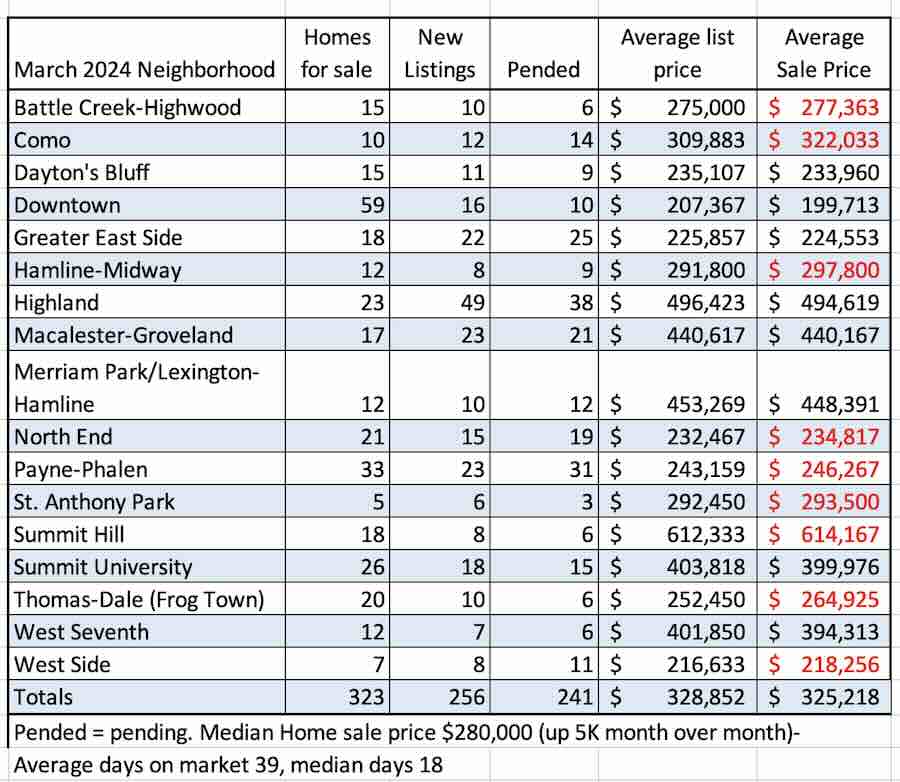
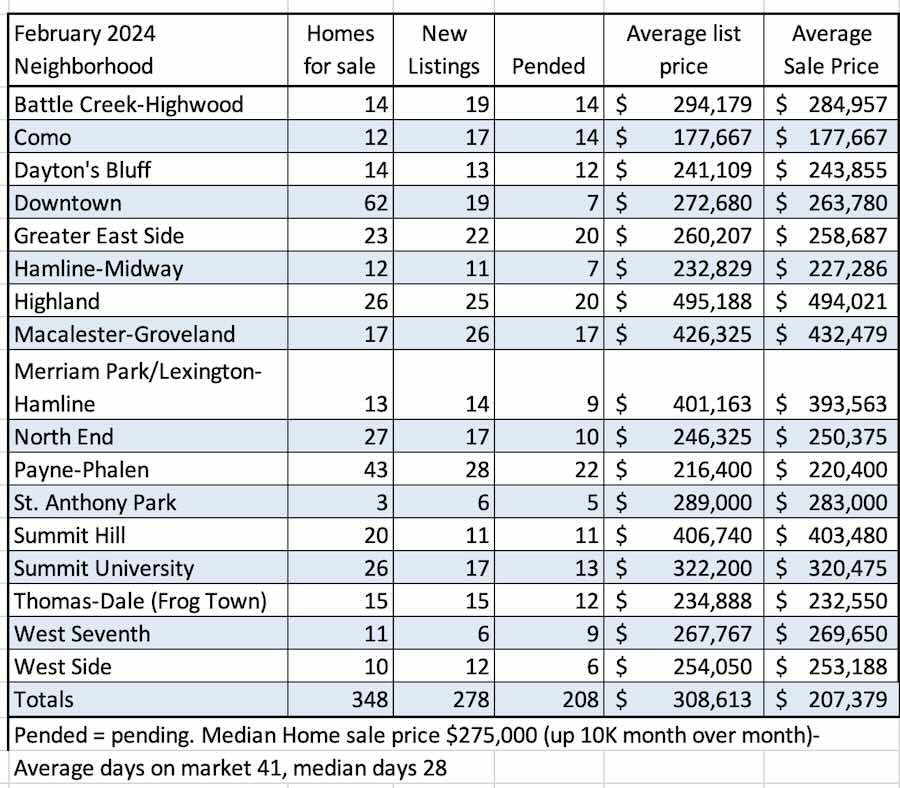
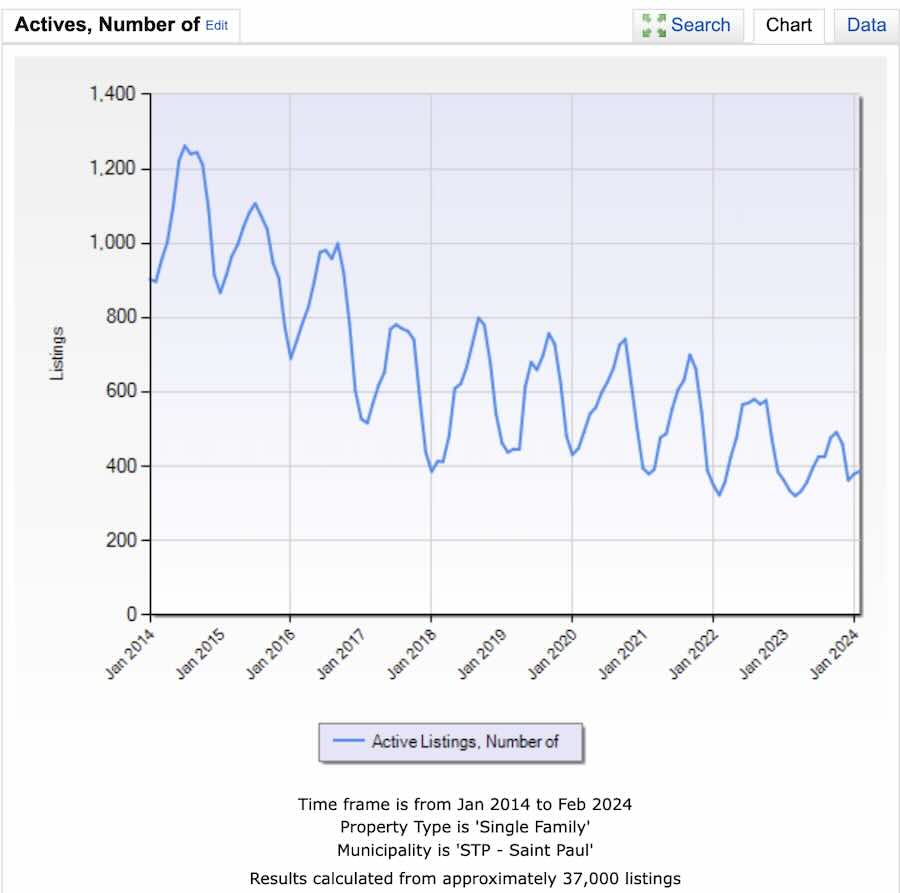
Home Sales and Prices by St. Paul Neighborhood

June09_wm

The data used to make this table was complied from the data in the RMLS (regional multiple listing service), it is considered reliable but not guaranteed. The numbers are for all residential, single family homes, including town houses and condos listed in the in the city of St. Paul.

It looks like we had more activity in June as far as home sales as we have had in previous months and the inventory of homes on the market has gone down again. Of the 1667 homes currently on the market 1177 of them are listed at less than $200,000 and 413 are listed for less than $100. Of the 389 homes that actually closed 161 of them were in the 100 to 200K price range, and 133 of them were priced below 100K. There wasn't much action in the higher price ranges or as much inventory.

Homes have become more affordable and there are bargains out there.  We are seeing some changes because of changes in the appraisal rules and standards. It has been harder this last month to get financing and we are seeing more cases where the home appraises for less than what the buyer offers. In some neighborhoods there are so many foreclosures that it is hard for both Realtors and appraisers to find comparable properties to use for pricing. 

Prices have gone up slightly for the 4th month in a row. Buyers and sellers are asking if we have hit bottom.  I wish I could answer that question. For buyers who are sitting on the fence all I can say is that it has been several years since homes have been as affordable as they are today and at the same time interest rates are low and there is the $8000 tax incentive that expires at the end of the year. 

The median sale price for all of the homes sold this year, year to date is $97,500.  For last year the over all median price was $187,275. 

For more charts, numbers and graphs, which I know you all love. See the local market conditions category.

Real Estate Listings Vs. Pending Sales for St. Paul, MN

July2009_wm

Some numbers . . . and then some more numbers.

The red line on the chart above shows the number of homes that were listed for sale through the Regional Multiple Listing Service (MLS) each week since the beginning of the year.  The blue line shows how many homes had offers made on them that were accepted by the sellers during the same week. Some of the homes have closed and some have not. Pending sales and listings are a metric used to measure the health of the real estate market.  Real estate is local and these numbers are for St. Paul Minnesota, but are pretty similar to the rest of the metro area.

The inventory of homes on the market continues to decline.  There are currently, and I will use the word only this time, 1668 homes on the market in St. Paul.  That doesn't mean that they are selling briskly. They sell quickly in the lowest price ranges and much slower in the higher price ranges.  Condo and townhouse sales are especially sluggish.

For those who are looking for bargains there are some bargains.  For the pickiest of home buyers there isn't much to choose from. . . I a not kidding in some price ranges it is slim pickings.  I'll post the prices by neighborhood on Monday.  Home prices on average continue to trend down ward but at a much slower rate than they did a year ago.

For more charts and numbers see local market conditions and home prices


Renting out the condo

Townhouse We still have plenty of townhouses and condos on the market in St. Paul, and they are still selling at a slower pace than all other types of single family home.  On average they take 36% longer to sell.

Some of the sellers have given up for now and are renting their units, others try to rent them out while they are on the market.  As a Realtor who has been through this more than a few times there are some pitfalls to having renters in the unit while it is on the market.

1.  There is the messy renter, the place is never in good shape for showings.

2.  The uncooperative renter.  There is never a good time to show the place.  I understand this and I know I wouldn't want to pay rent and then have to have people traipsing through the place and disturbing my day.

3.  The surly renter.  I won't even explain that one, but sometimes renters get involved when there are people seeing the home and they say all sorts of things.

The up side to renting out a condo is that the seller has a way of making the mortgage payment and can move on and wait awhile to sell it.

There is another issue with renting out condos or townhouses and that is that in some buildings and developments the percentage of owner occupied units is so low that units no longer qualify for FHA financing.  This is becoming a big problem  These days FHA financing is very popular for first time home buyers and units that can not be financed through FHA are hard to sell.
There are no easy answers and it is a vicious circle. Would be sellers end up renting because it takes so long to sell or they owe more on the unit than they can get for it, and can not afford to sell it.  Rented units are harder to sell and your rental unit may be killing your neighbors chance of selling their unit to the growing number of buyers who are using FHA.  

Very local market snap shot

House2 It has been in the news that the number of homes sold is up and that more homes have sold this year than last year. I suppose that is a good thing especially for those who have homes to sell and for those of us who sell those homes.

I ran some numbers using the data in our Regional Multiple Listings Service for St. Paul, MN.  The data is deemed reliable but not guaranteed. I looked at total closed sales for 2008 in the city of St. Paul for all types of single family homes, which includes condos and town houses for the first half of the year and compared those numbers to the numbers for the first half of this year.

In the first 6th months of 2008 there were 1071 homes sales in St. Paul, buyers paid an average of $65.37 per square foot. The homes were on the market for an average of 145.6 days.  The total amount of money for those homes adds up to $185,441,972

In the first 6th months of 2009 there were 1372 home sales in St. Paul and buyers paid an average of 117.93 per square foot.  The homes were on the market for an average of 145.6 days and the total amount of money for the sales of those homes adds up to $168,844,322

Foreclosures are the reason for the lower dollar volume. There were times during the first half of this year when 50 to 60% of all sales in St. Paul were foreclosures. The average home has dropped in value in most neighborhoods but not by as much as the homes that were sold after they were bank owned.

Some see the increase in sales as a sign that the housing market is on the rebound. I don't see it that way. I think the numbers mean that a bunch of foreclosures sold because the prices were so low and the tax incentive helped fuel the buying.

The big change between this year and last year is that the inventory of homes on the market was much lower during the first hafl of 2009 than in 2008.

Absorption Rates

Rocks_f I was pretty excited last month when I used a graphic of cotton swabs to illustrate the absorption rate. It was not all that long ago that I was using toilet paper, paper towels, super absorbent diapers and even a wet dry vac to help absorb  all that inventory.  There isn't much to absorb now and it is slim pickings in some price ranges.

It wasn't easy but I found something less absorbent than cotton swabs.   I think these rocks will do the job for this months inventory and if the absorption rate goes lower next month I will have to use industrial grade toilet paper as that is the only thing I can think of that would be less absorbent than these rocks.

Absorption rates are a  calculation of how long it will take for all the homes on the market to be sold, or absorbed, at the current rate of sales.

I do love numbers, and these are in months, the data used came from the RMLS, (MLS) and is deemed reliable but not guaranteed.  It doesn't come with a warranty either. Maybe an implied warranty but what do I know? I am a Realtor not an attorney.  These numbers covers what is referred to as the 7 county metro area not to be confused with the 13 county metro are which covers the same area, plus six more counties.  

Anoka County 4.9 Months
Carver County 6.1 Months

Dakota County  4.8 Months

Hennepin County 4.5 Months

Ramsey County  4.3  Months

Scott County  5.6  Months

Washington County 5.9 Months


The absorption rates are slightly lower than they were last month.  Normally a six month absorption rate is indicative of a balanced market that does not favor buyers or sellers, an absorption rate of less than six months is indicative of a sellers market.  This market still favors buyers and I am going to call it a buyers market, except in the very lowest price ranges where we are now seeing multiple offers as banks continue the clearance sale they are having on foreclosures.  The percentage of homes on the market that are in foreclosure has gone down but I expect that to change soon.  If you don't believe that it is a buyers market just ask the traditional who has had their home on the market for six months or someone who has had to reduce the price a few times.They will tell you that the buyers are still in charge and they are looking for bargains.

I'll predict that for next month I will be able to use the cotton swabs again, and don't believe that I will ever have to pull out the industrial grade toilet paper. . . . but we shall see.

Home sales and prices by St. Paul neighborhood

The data used to make this table was complied from the data in the RMLS (regional multiple listing service), it is considered reliable but not guaranteed. The numbers are for all residential, single family homes, including town houses and condos listed in the MLS during the month of May 2009, in the city of St. Paul.

Maynumbers_wm

The average sale price went up a bit, mainly because the clearance sale on the foreclosures seems to be running out of steam, as the inventory of such homes gets smaller. The number of homes on the market, and the number of new listings dropped slightly from last month and the number of pending listings is up slightly.  There are about half as many homes on the market in St. Paul is there were in the late summer and early fall of last year.

I don't have the data available to back it up but short sales seem to be on the rise and I am getting more inquires from people who are behind on their mortgage payments. Buyers remain very timid.  Interest rates are still low and their are bargains to be had.

For sale forever?

Brickhouse I found 107 homes listed on the MLS that have been on the market for more than 500 days.  That is a long time even in today's market.

Of the 1768 homes that have sold this year in St. Paul the average cumulative days on market was 137.

Town homes and condos take about 90 days longer to sell  on average than single family homes and most of the homes that have been on the market more than 500 days are townhouses or condos.

Buyers look at how long a home has been on the market.  Sometimes the information is used to determine how much to offer for the home and in other cases they get cold feet and make no offer because the home has been on the market for so long.

When I look at these listings I check to see if there have been any price reductions.  If I see a home that has been on the market for a long time, like over a year and the price has never changed I assume that the sellers are not very motivated wonder if they are open to negotiation.

As a listing agent I am not open to the idea of having a listing that has sat on the market for more than a year with no price reductions. I start spending money on my listings before the ink is dry on the contract but do not make a dime until the sale of the home closes.

Case-Shiller = Fun!

by G. Sax

Case-shiller I read this blog's comments. Most are interesting and expand upon the conversation. In yesterday's post about porches, there was a comment from a reader named "Bubble_Up" about local housing prices.

The comment didn't have anything to do with porches, but it was cool to see something about Case-Shiller. We have an informed community here, which is good for those of us who like to contribute to the conversation.

So I thought I'd shelve my quirky, neighborhoody banter this week in favor of a chat about the S&P/Case-Shiller Index, the de facto national housing report that reporters flock to.

I'm not interested in debunking Case-Shiller, which some real estatees try to do, including the National Association of REALTORS®. Case-Shiller isn't the real estate devil. It provides a decent snapshot of the American housing market.

The indices were developed by economists Karl Case and Robert Shiller. The 20 largest metro areas are measured using a repeat sales pricing technique to create data pairs; data is collected on single-family home re-sales. The report is produced by Fiserv Lending Services, and many of the indices are managed by Standard & Poor's. (click here to view them)

The Twin Cities took a media beating because of Case-Shiller yesterday. Bubble_Up brought this to our attention with a quote from the St. Paul Pioneer Press: "The report found that home prices in the [Twin Cities] metro area plunged 6.1 percent between February and March, falling back to a level not seen locally since September 2000, according to Case-Shiller." (read full article)

I work in real estate PR, so I took a bunch of calls on Case-Shiller yesterday. The report got the basics right...prices are down here, there and everywhere.

But the increase in Twin Cities foreclosure and short sales activity over the last year wasn't really noted in the first wave of media reports. As the day wore on, we were given a chance to explain our "record decline." More than half of all home sales in the Twin Cities in the first quarter of 2009 involved banks. In April, banks were still in on 46 percent of sales activity, often at deep discounts in already-low price ranges. This drags regional median prices down.

We're backtracking on price, but you're not likely to get a traditional home sale (one with a real person behind the sale and not a bank) at 2000 or even 2002 prices. We're still in tricky waters, for sure, but the situation is more complicated and more localized than Case-Shiller covers.

Foreclosures are selling rapidly and inventory is shrinking. Next year at this time, Case-Shiller may be reporting that we've had record month-over-month increases. And we may be explaining that the increases are statistical anomalies.

In closing, I'm a big fan of porches. I look forward to many summer nights on my front porch listening to Twins games on the radio, waving at neighbors, and watching the sunset wash the Cathedral in shiny orange pinks. All in screened-in luxury!

Listing Vs. Sales for St. Paul Minnesota, January to May 2009

May2009_wm  
The red line on the chart above shows the number of homes that were listed for sale through the Regional Multiple Listing Service (MLS) each week since the beginning of the year.  The blue line shows how many homes had offers made on them that were accepted by the sellers during the same week. Some of the homes have closed and some have not. Pending sales and listings are a metric used to measure the health of the real estate market.  Real estate is local and these numbers are for St. Paul Minnesota.

There are a couple of weeks where there were more offers than new listings and for the first time in a long time the number of offers hit the triple digits a few times.   We have had many weeks where we hit the triple digits for listings but not for offers.

A few months ago I wrote about how in 2007 the trend lines were going in opposite directions. The number of listings was increasing and at the same time there were fewer offers on homes. Now the lines are meeting and the blue line is at a steeper pitch than the red.  The number of listings has been leveling off while offers increase.

There are about half as many homes on the market in St. Paul as there were last August of 2008, and slightly fewer than there were in April of 2009. The inventory of homes on the market has been decreasing for months, fewer are being listed and more are being purchased. 

What does this all mean? I have some theories. lets just say that there are people who want to sell and can not and there are people who are a couple of months behind on their mortgage payments who are exploring their options.  There will be more foreclosures and that will bring the inventory up. Will there be enough buyers to absorb it or are we just seeing a little spring buying activity fueled by pent up demand, tax incentives and oh so low interest rates?

For more local monthly numbers see local market conditions

The economy . . . .

Houselete News about the economy is everywhere.  I am bombarded by it from the TV and the newspapers and all over the internet.

In the last couple of weeks I have been reading that we have hit bottom and things will get better.  I want to believe it but I don't.

Activity has picked up in the housing market but the prices have gone down, there are too many foreclosures and there are two many people who want to sell but can not because they owe more on their homes than they can sell them for.

Yesterday I learned that yet another one of my neighbors has been laid off and I see so many for rent or for sale signs in the vacant store fronts and office spaces around town.

Local restaurant owners tell me that business has been down. and I notices signs in front of businesses offering "economic incentives".

I am no expert but I am not seeing any signs of improvement in the economy.  I don't think my neighbors are either. 

As for the housing market it is what it is.  A good time for buyers if they have a good job and are in a position to buy a home. A bad time for sellers unless they have equity.  Many of the sellers do not have enough equity to accept the low ball offers that buyers are making and buyers will only buy if they think the home is a bargain.

Search for homes2

My Listings

Feeds

  • © All rights reserved

Visitors


Contact Info

Powered by TypePad
Member since 11/2005