Here are some numbers for home sales in St. Paul, Minnesota for the month ending February 29. The high demand and low supply kept home prices up. Most of the city is experiencing a strong seller’s market. Downtown St. Paul is experiencing a weak seller’s market.
Overall the average days on the market is 41 days. Interest rates went up in February and mortgage applications went down. Experts are predicting lower interest rates during the second half of the year with home sales rising in 2025.
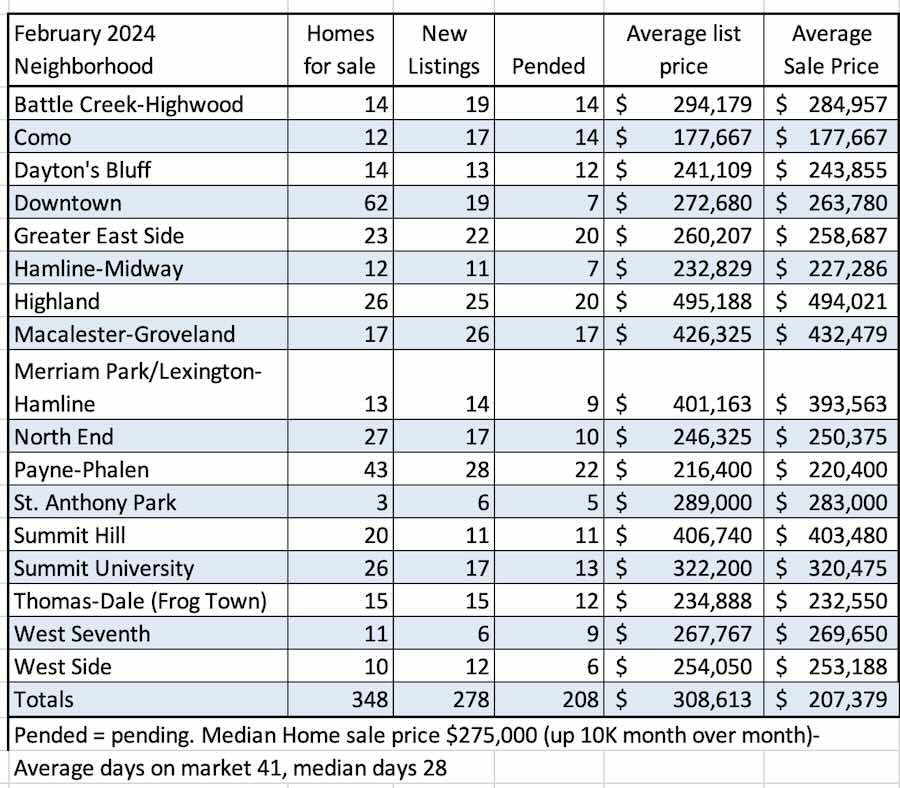
The numbers used in the chart were extracted from the NorthstarMLS which is deemed reliable but not guaranteed. Other sources of this information include areas outside of the city of St. Paul, the information presented here is inside the city limits and does not include suburbs.
