This is a great time of year for taking pictures. The weather has been warm and dry and the fall colors were at the peak last weekend.
stpaul


- Photos
- ...
Out at night
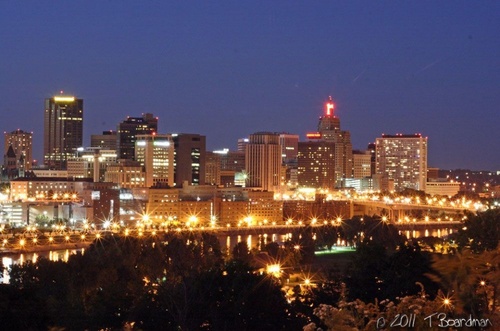
St. Paul MN

To really see this photo you need to click on it to make it bigger. This is my favorite time of year for night time photography because the days are shorter and it is still warm out. I take this shot just about every year from the South end of the Smith Avenue High Bridge looking toward downtown St. Paul. This is a long exposure, 49 seconds to be exact.
How is the housing market affected?
Last week is one that I won’t soon forget and it will be a long time before I have any faith in our national or state government. If elections were held today I would be hard pressed to vote for anyone who is currently in office but I will cross that bridge when re-election time comes around again.
The dept ceiling crisis, lowered credit rating and high unemployment numbers will impact the housing market. We have already seen the negative impact on the stock market.
This chart below shows how many appointments were made for private showings of homes listed for sale in our MLS and the data was created with the report writer in Book A Showing which is the nifty appointment scheduling system built right into our Local multiple listing service. I don’t know the exact correlation between showings and sales but there is a correlation. When home showings go up sales follow.

The chart for 2011 paints a healthier picture of the local real estate market this summer than last. After the tax credits in 2010 expired the number of home sales and home prices both went down. Real estate here in Minnesota is seasonal and it is normal for home viewing and sales to be the lowest in December and January.
If you have a home to sell I can tell you that homes in the area sell every day. We will continue to sell homes and there are always buyers.
Interest rates remain at historic lows which makes owning a home more affordable than it has been in a long time. For some owning is now cheaper than renting. The latest economic news and turmoil have already had an impact on mortgage interest rates, they have gone down slightly. Talk to your lender but today may be a great day to lock in.
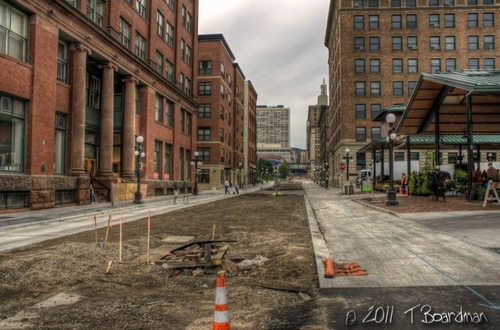
LRT Construction Update

Robert Street N

You may want to view the larger version of the Robert street photo. Click on it and then you can see all the equipment, dirt and orange cones. When I was processing it I noticed that at full size I could see the Robert Street bridge.
Fourth Street E

I have been taking photographs of light rail construction for a year now because I think they make better updates than the updates. I could take some more on University Avenue but there isn’t anything new to photograph.
Did you know that street cars used to run on Robert Street and on University Ave?
Absorption rates
Absorption rates are a calculation of how long it will take for all the

cotton swabs

homes on the market to be sold, or absorbed, at the current rate of homes sales and with the current number of homes on the market. The numbers tell us if we are in a buyers market or a sellers market. I do love numbers and these numbers are in months, the data used came from the RMLS, (MLS) and is deemed reliable but not guaranteed. Sadly there are no guarantees in life. These are for the seven county metro area which is like the 13 county metro area except smaller and are for the last 30 days.
Anoka County 5.1 Months
Carver County 6.3 Months
Dakota County 4.7 Months
Hennepin County 3.1 Months
Ramsey County 5.7 Months
Scott County 5.1 Months
Washington County 5.0 Months
We are at the cotton swab stage where there is really very little inventory to absorb. . . yet it does not feel at all like any sellers market that I can remember. Absorption rates were at the qtip level last April as well.
For related posts see Local Market Conditions and Home Prices