Sometimes people tell me what “they” are saying about the real estate market and they say all sorts of things. Real estate is local and what they say may not be accurate for your neighborhood. In general home prices have gone up in the Twin Cities this year but in some communities they have stayed about the same while in others they have gone up by 13%.
Across the board home values ae significantly lower than they were in 2006 but they are slowly climbing up from the great bottom of 2009-2011.
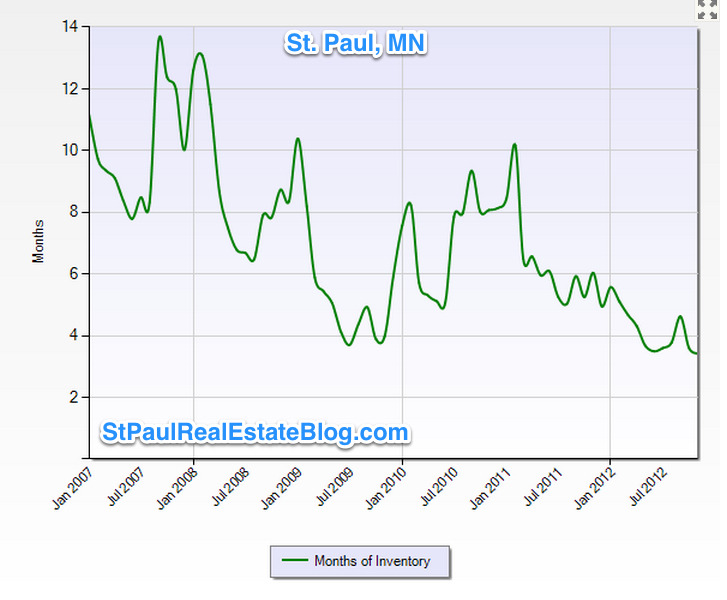
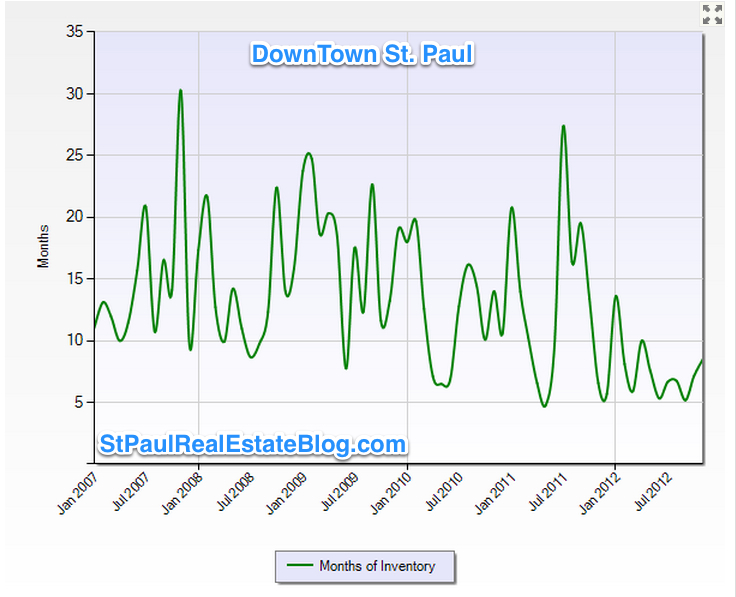
Here are two charts using data taken from the regional Northstar MLS which is deemed reliable but not guaranteed. The first chart shows the absorption rate of homes in St. Paul and the second shows absorption rates for downtown St. Paul.
St. Paul and downtown St. Paul are two very different housing markets. There is less than a four month supply of homes on the market in St. Paul but in downtown St. Paul there is about and 8 month supply of homes on the market.
Absorption rates show how many months it will take to sell the real estate on the market in a giving area based on how many are purchased each month Vs. how many are on the market. It is an indicator of how long it takes to sell property and the overall health of the real estate market.
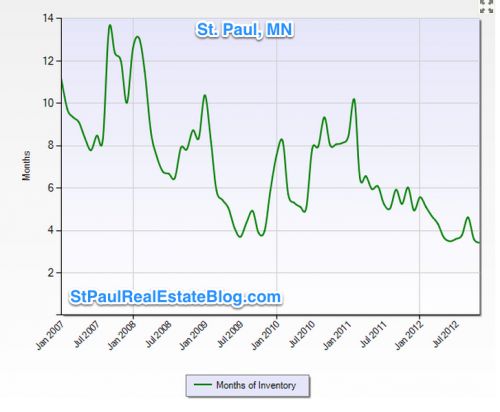
Less than 4 Months Inventory
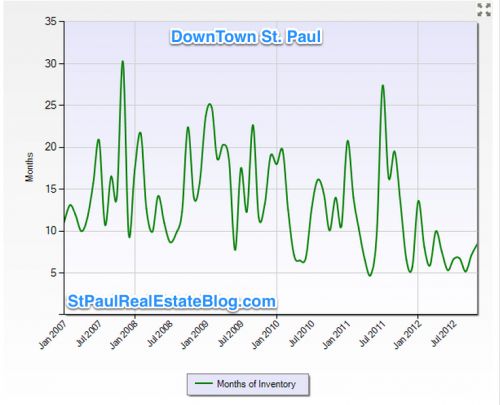
More than 8 Months of inventory
There are local and national trends that can not be ignored. The market is improving and the number of bank foreclosures continues to decline.
The number of homes for sale continues to decline which will drive prices up it home buyer demand remains strong and can get financing.
