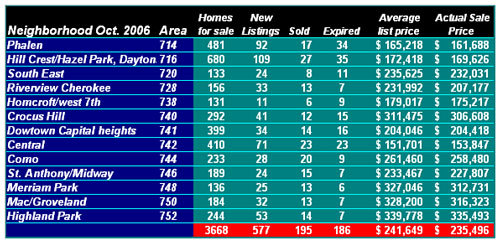
October Numbers By St. Paul Neighborhood
Averages taken from the Northstar MLS, this information is deemed reliable, be not guaranteed. The total namer if homes on the market for sale is declining, but the number of new listings is higher for October than it was for September. More homes were sold in September than in October. The average actual sale price is down from last month but that number tends to go up and down from month to month. A six to twelve month average is needed to get a meaningful number.
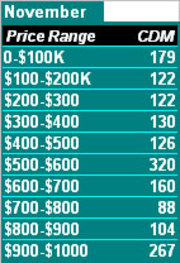
Here is a quick look at days on market which has not changed much since August. The numbers represent the average cumulative days on market by price for all homes currently on the market in St. Paul. This data is also from the MLS. According to the Minneapolis Association of Realtors there is about a 7.7 month supply of homes on the market, which means at the current rate of home sales it will take 7.7 months for all the homes currently on the market to be sold.
With interest rates on 30 year mortgages at about 6.3%, this is a great time to buy a home. 
