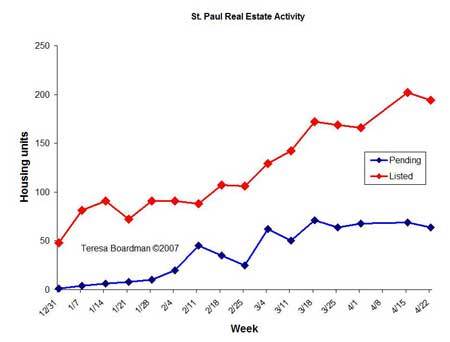
A week by week look at the St. Paul real estate market. Then number of new listings coming on the market each week remains higher than the number of sales each week, a similar pattern to what we saw in 2006. The data used to make the chart was gathered from the Regional Multiple Listings Service and is deemed reliable but not guaranteed.
What for April home prices by neighborhood on May 7, 2007.
