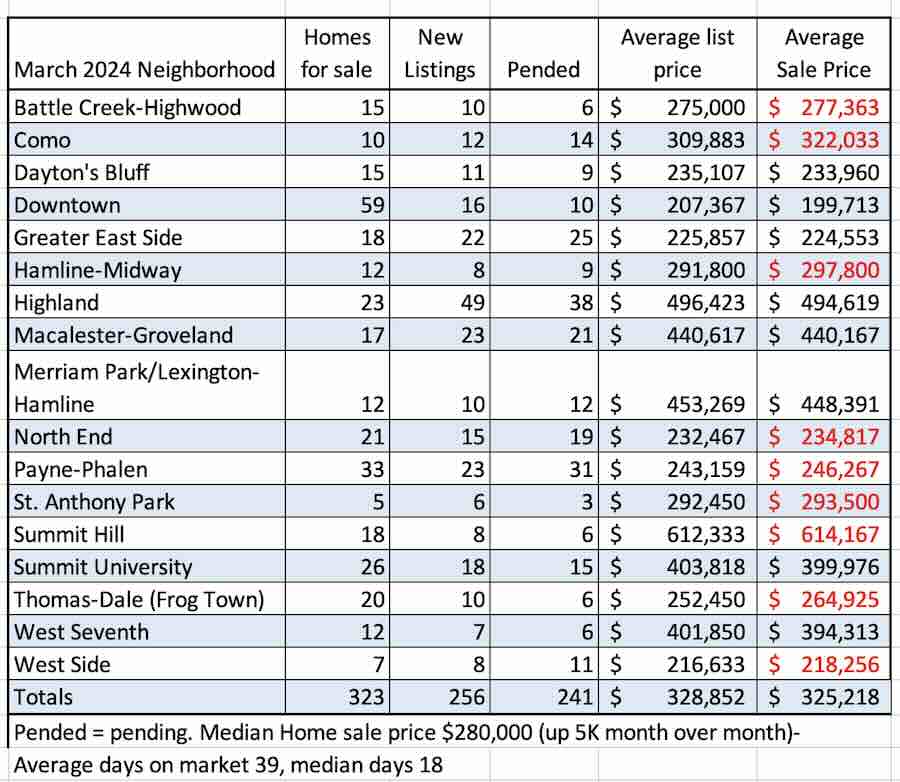
Here we go some fresh numbers for single family home sales in St. Paul during the month of March. Home sales are down due to the lack of homes for sale. Overall prices are up slightly.
Homes are selling faster when compared with February. Must be spring.
Mortgage interest rates are too high and so are home prices, which rose due to high demand and low rates. Some real estate professionals are advising their clients to buy a house even though rates are 7%ish.
“Marry the house, and date the rate”. This catchy phrase has become popular advice and a catchy phrase since the Spring of 2022 when mortgage rates increased to 20-year highs.
The phrase “Marry the house, and date the rate” means you’re committing to a long-term relationship with the house you love. But you can dump the interest rate when you refinance.
Not so fast. Rates will remain high for a few years and it will take a few years just to build some equity at today’s prices. In fact, you can’t really date a rate. Well maybe you can but you don’t get to just decide when to date another rate.
When a borrower refinances to a new rate they start all over making mostly interest payments. People who have been laid off generally can not refinance. There are fees and closing costs too. In most cases, a borrower would need to own the house for at least three years and rates would have to go down by 2%. Good luck with that.
When my husband and I bought our first house rates were over 8.5%. At the same time houses were less expensive back then and our monthly payments were just a little more than rent.
We can not assume that home values will always rise and that rates will go down soon. Housing prices can go down or stay flat and rates can go up. In fact, sometimes renting makes more sense than buying. A home buyer could date an apartment and eventually marry the right house at the right price.
Typically the real estate agents promoting this phrase “Marry the house, and date the rate” either don’t know any better or are a bit sketchy.
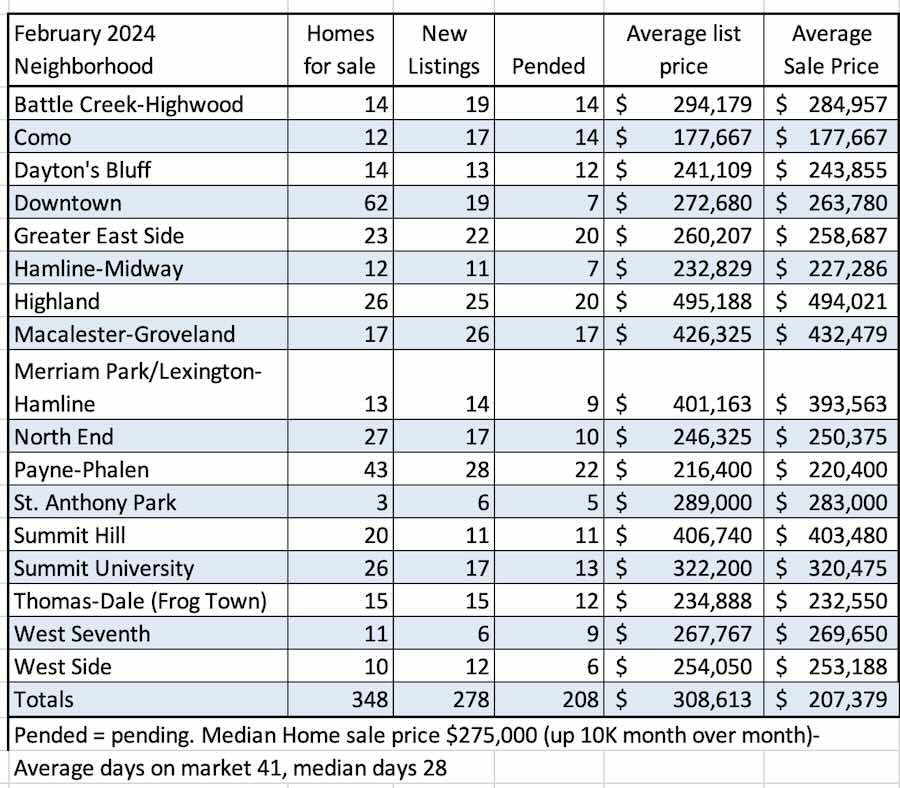
Here are some numbers for home sales in St. Paul, Minnesota for the month ending February 29. The high demand and low supply kept home prices up. Most of the city is experiencing a strong seller’s market. Downtown St. Paul is experiencing a weak seller’s market.
Overall the average days on the market is 41 days. Interest rates went up in February and mortgage applications went down. Experts are predicting lower interest rates during the second half of the year with home sales rising in 2025.
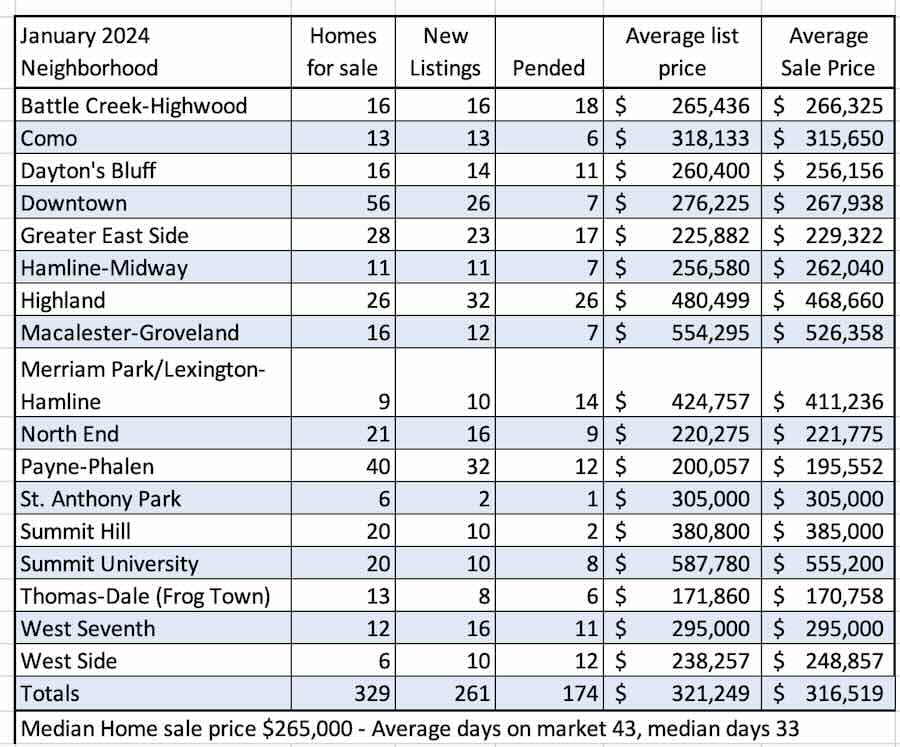
Home sales by St. Paul neighborhood
The numbers used in the chart were extracted from the NorthstarMLS which is deemed reliable but not guaranteed. Other sources of this information include areas outside of the city of St. Paul, the information presented here is inside the city limits and does not include suburbs.
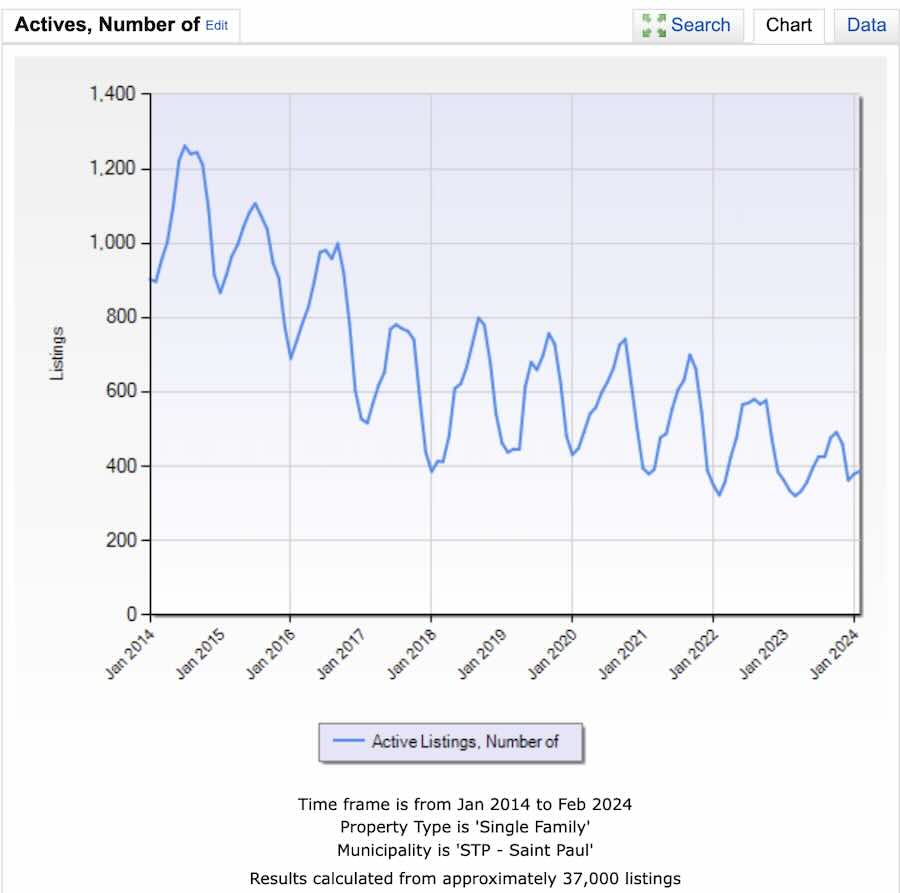
The trend is down for the number of houses on the market in March. It isn’t just about higher interest rates, but nterest rates are making it worse. It is also about fewer reasons to move. Fewer people are moving because of a new job. Demographics are another reason for staying put. Older people do not move as often as younger people do. Add a shortage of housing to the mix and we have yet another reason why people don’t move.
The chart shows the number of houses on the market each month in St. Paul over the last decade. The peaks each year occur in the spring, and the valleys happen during the holidays at the end of the year. I’ll have some numbers for February 2024 home sales on Wednesday, March 6.
Number of houses for sale – data from the Northstar MLS
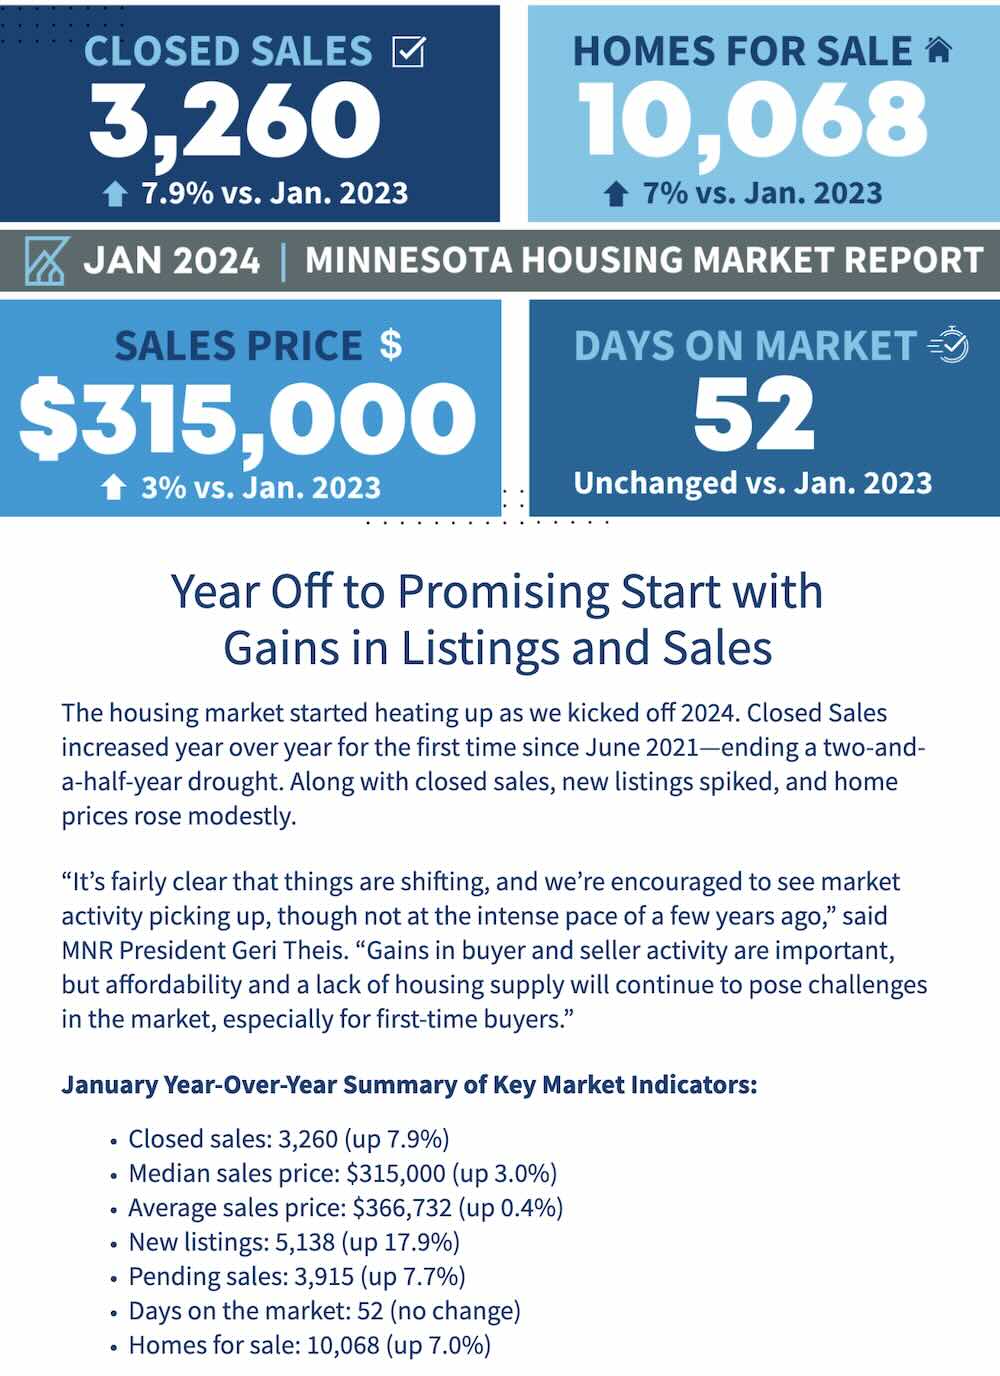
The infographic is from Minnesota Realtors which is our state Realtor Association. Home sales were up in January year over year and there are more houses on the market this January in Minnesota than there were in January 2023. Home sales prices are up and interest rates were slightly lower this year than last year but too high.
So far this year is kind of a yawner when it comes to home sales. Median home sale prices are up from last January, but everything else is pretty much the same. Fewer homeowners want to move away from the low mortgage interest rate they have and are not putting their homes on the market.
The demand for homes is high and the supply is low. We have been seeing the same trend for almost a decade.
The numbers in the table below is a summary of data extracted from the Northstar MLS which is deemed reliable but not guaranteed. An MLS is a database of homes for sale that have been listed by Realtors. Homes for sale on real estate company websites and on the major real estate portal sites receive all or most of their data from MLSs.
Since real estate is local I like to publish the numbers for St. Paul, sorted and subtotaled by neighborhood.