The inventory of homes for sale in Minnesota is still low but even though prices are up and interest rates are up homes are still selling quickly. The closed sales column is down due to fewer houses on the market.
The prices went up because the demand remains high.
This just in from Minnesota Realtors, which is the Realtors Association for Minnesota of which I am a proud member.
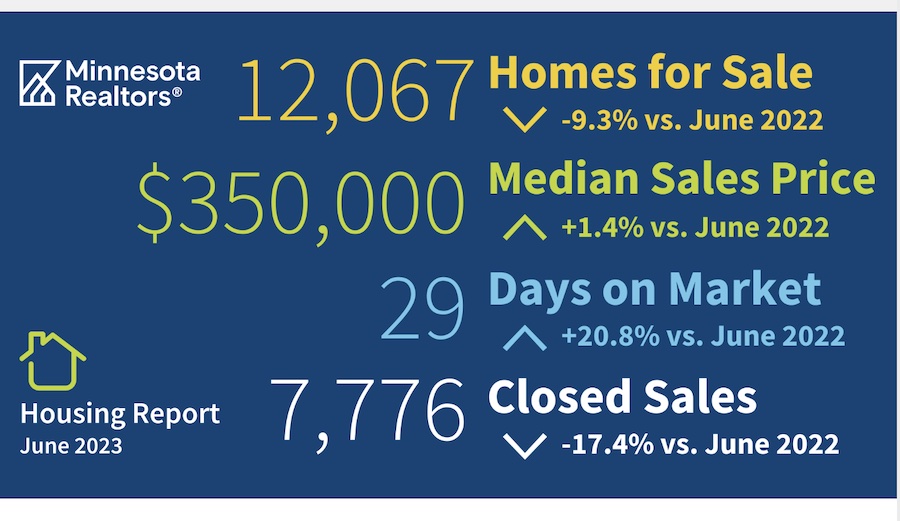
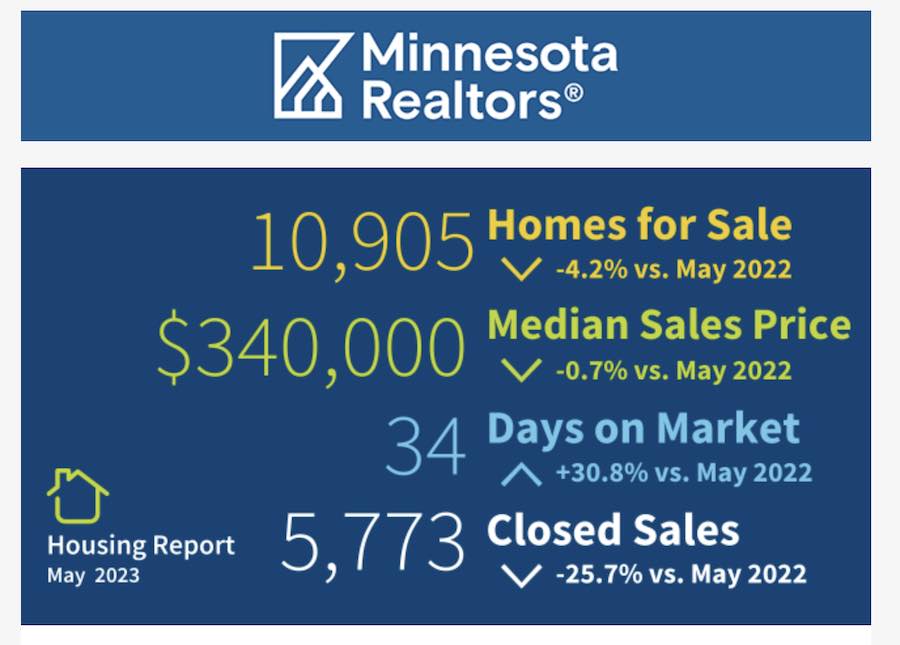
“Closed sales fell by almost 26% compared to the same period last year, ending the month at 5,773. New listings were also down 15.3%, while pending sales dropped about 16%. But inventory ticked up to 1.9 month’s supply, a nearly 27% jump versus last May, providing more purchasing opportunities for some house hunters.”
May year-over-year summary of key market indicators:
Closed sales: 5,773 (down 25.7%)
Median sales price: $340,000 (down 0.7%)
Average sales price: $392,785 (down 0.4%)
New listings: 9,803 (down 15.3%)
Pending sales: 7,185 (down 16.1%)
Days on the market: 34 (down 30.8%)
Homes for sale: 10,905 (down 4.2%)
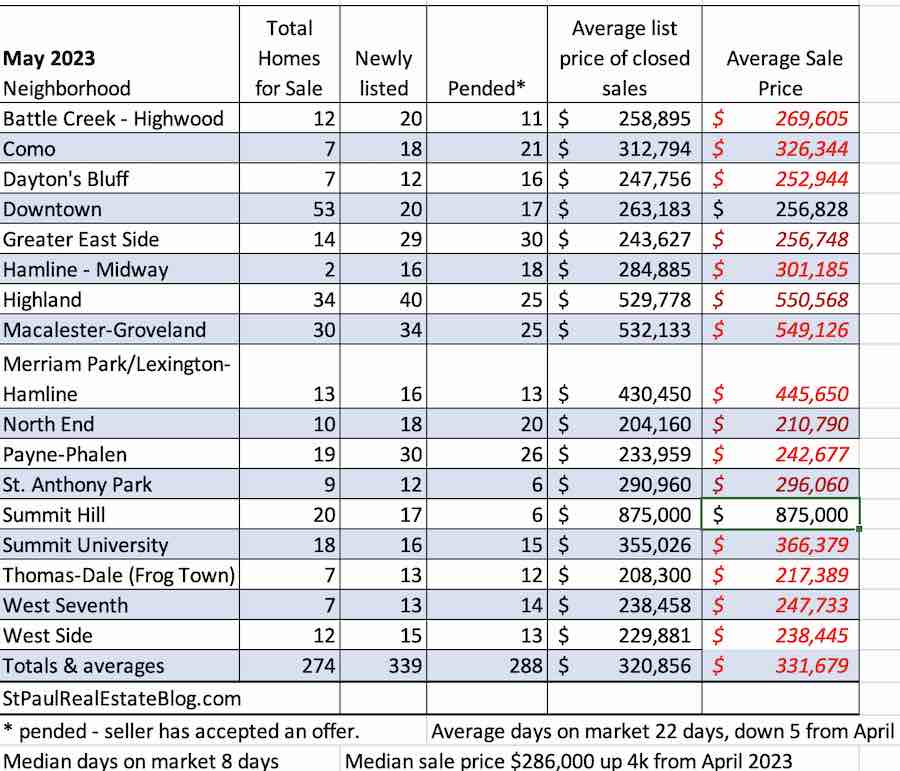
Home sales May 2023, Minnesota
Look for interest rates that are lower than they were last week but still more than 6.5%.
Is this a good time to sell your house? The short answer is yes and this is why:
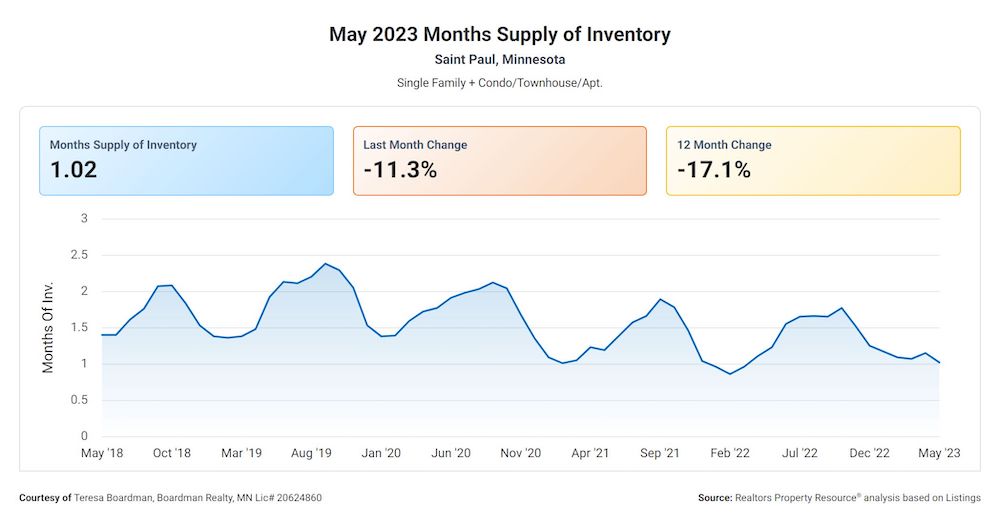
The Months Supply of Inventory is currently at 1.02. This metric indicates how long it would take for all the homes currently on the market to sell, assuming no new listings are added. A lower number is generally considered good for sellers as it means there is less competition and higher demand for homes.
The 12-Month Change in Months of Inventory is currently at -17.07%. This metric shows how much the Months Supply of Inventory has changed over the last 12 months. A negative percentage is a good sign for sellers as it means there is a decreasing supply of homes on the market.
The Median Days Homes are on the market for an average of 13 days. In other words, homes are selling quickly. Often we put them on the market on a Thursday and the owners have a few offers to choose from my Sunday.
The List to Sold Price Percentage is currently at 103.4%. This metric indicates how much of the original listing price homes are selling for. Sellers are getting their asking price and more.
The Median Sold Price is currently at $295,000. This metric shows the middle price point of homes that have sold in the area. This number is still rising.
Overall, these metrics indicate a strong seller’s market with low inventory, quick sales, and high prices.
Months supply of homes for sale in St. Paul
Why is there a shortage of homes for sale? Two reasons:
Fewer homes are being built since the housing market crash in 2009-2011. At the same time, there are more households now than there were then.
Many current homeowners have mortgages with low interest and are unwilling to move up to higher rates.
For the last few years real estate professionals and the media would often describe the real estate market as “crazy”. That term doesn’t mean much. It was an unusual market in that during the pandemic people were moving. It was kind of crazy. It almost felt like a frenzy. We sold houses quickly before the sign came. Sometimes buyers did not even tour the house before making an offer.
It was good for business too at least for those who did not have to worry about catching Covid-19 or spreading it to their family.
When the interest rates started going up last year the market changed. Cash offers are more popular than ever and some home buyers are having inspections and asking for repairs.
Multiple offers are still common but in general, we are seeing a couple of offers or a few offers rather than several or many offers. It only takes one good offer to sell a house.
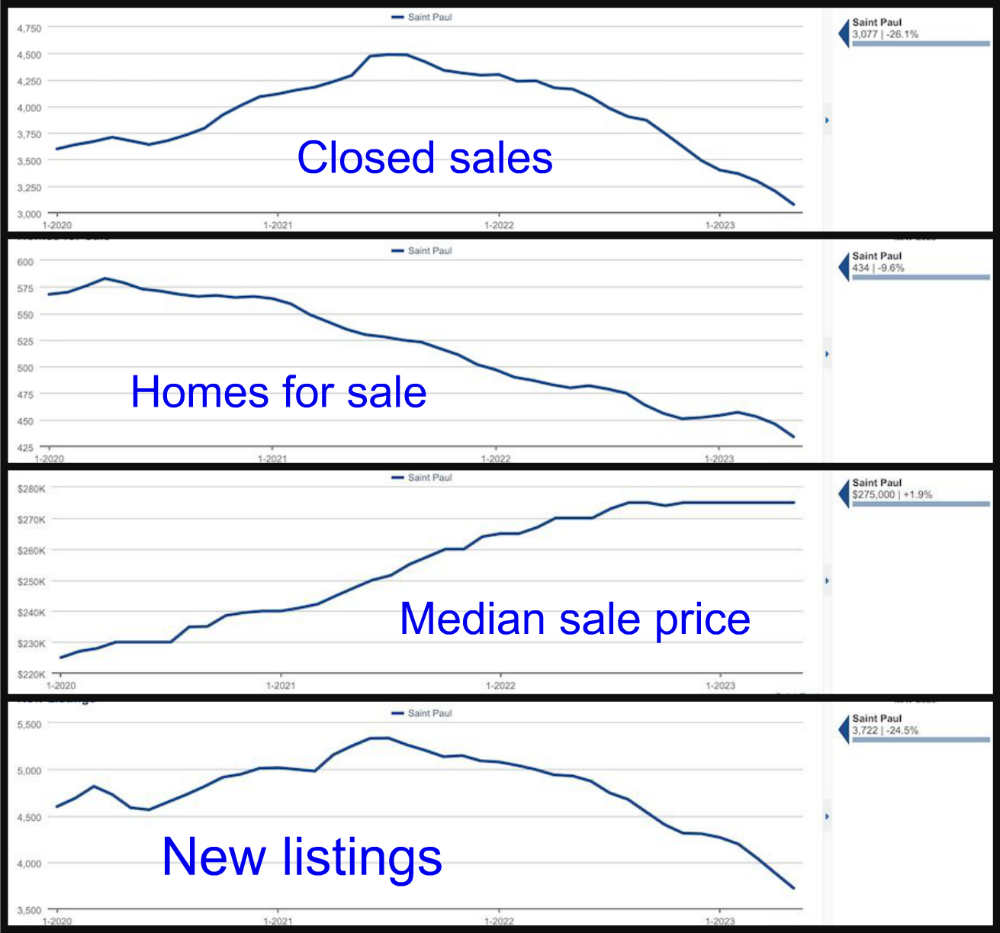
Here are some graphs that show some key indicators in the housing market. The numbers are for the last three years. Prices in the area are definitely plateauing.
Interest rates have caused sellers to stay put and wait for rates to go down before moving. Buyers still want to buy. Usually, new listings are up this time of year. Home prices often peak in April and May. I am going to call it and say that they have peaked for 2023.
It will be interesting to see what the fall and winter bring.
The home sale numbers for May don’t look all that different from the April numbers. The low inventory of houses on the market and the high demand keep prices up. Residential real estate is selling quickly and often for more than the asking price.
We are still experiencing a strong sellers’ market. It will take a while for higher mortgage interest rates to have an impact. Rates just went up and will have an impact on June home sales.
Right now I am not recommending buying a house if you are a first-time home buyer who plans to use financing. If you are ready to sell now is a great time to sell your house quickly and for top dollar. We are seeing a lot of all cash offers.
The lack of supply and the high demand for housing continue to influence the housing market.
Yes I know it is closer to June than it is to April but it takes a while to get and tabulate all of those numbers. When I look at them I do see trends and patterns.
The number of houses on the market was up in April 2023 from 2022. That makes sense because there are probably fewer buyers due to higher interest rates. I think people are hanging onto their homes this year due to high-interest rates.
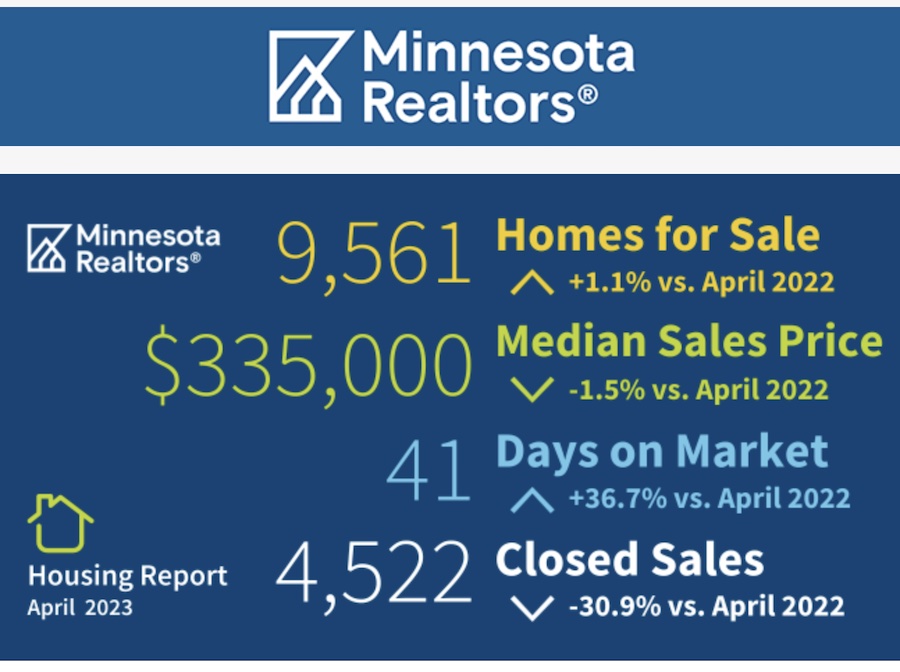
April 2023 home sales in Minnesota
According to Minnesota Realtors, which is the state Realtors Association,
“Closed Sales Down as Median Home Price Dips
Although the weather was warming, sales activity across the state iced over as closed sales dropped almost 31% compared to April 2022. Despite downward trends, competition for desirable properties remained brisk. On average, sellers were receiving 99.3% of their asking price, and in some areas, multiple offers continued to drive up the sales price.
April year-over-year summary of key market indicators:
Closed sales: 4,522 (down 30.9%)
Median sales price: $335,000 (down 1.5%)
Average sales price: $386,617 (down 0.6%)
New listings: 7,290 (down 27.0%)
Pending sales: 5,769 (down 28.7%)
Days on the market: 41 days (up 36.7%)
Homes for sale: 9,561 (up 1.1%)”
When we get the May numbers at the end of June I believe we will see an uptick in median home sale prices and home sales will be lower than in May 2022.