Is this a good time to sell your house? The short answer is yes and this is why:
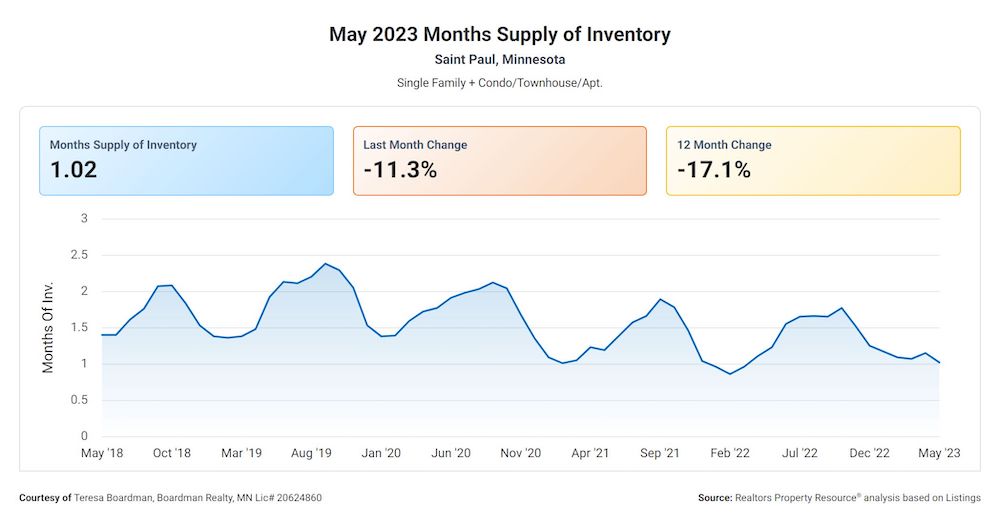
- The Months Supply of Inventory is currently at 1.02. This metric indicates how long it would take for all the homes currently on the market to sell, assuming no new listings are added. A lower number is generally considered good for sellers as it means there is less competition and higher demand for homes.
- The 12-Month Change in Months of Inventory is currently at -17.07%. This metric shows how much the Months Supply of Inventory has changed over the last 12 months. A negative percentage is a good sign for sellers as it means there is a decreasing supply of homes on the market.
- The Median Days Homes are on the market for an average of 13 days. In other words, homes are selling quickly. Often we put them on the market on a Thursday and the owners have a few offers to choose from my Sunday.
- The List to Sold Price Percentage is currently at 103.4%. This metric indicates how much of the original listing price homes are selling for. Sellers are getting their asking price and more.
- The Median Sold Price is currently at $295,000. This metric shows the middle price point of homes that have sold in the area. This number is still rising.
Overall, these metrics indicate a strong seller’s market with low inventory, quick sales, and high prices.
Why is there a shortage of homes for sale? Two reasons:
- Fewer homes are being built since the housing market crash in 2009-2011. At the same time, there are more households now than there were then.
- Many current homeowners have mortgages with low interest and are unwilling to move up to higher rates.
