April 2023 Home Sales for St. Paul

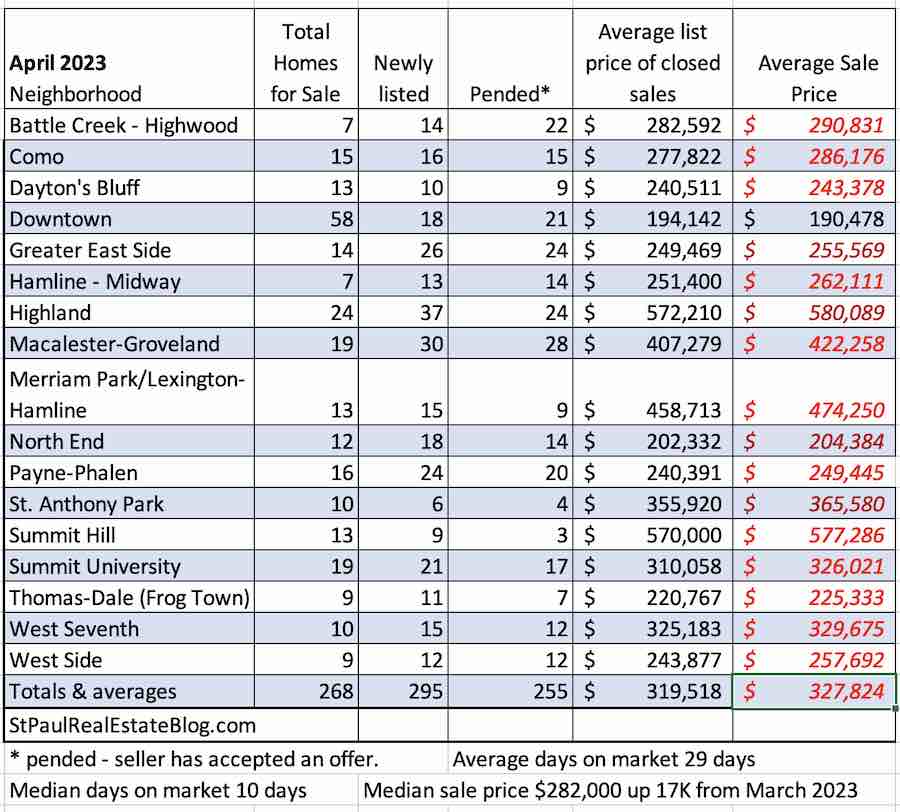
Table that shows home sales by St. paul neighborhood
Home sales and prices by neighborhood for April 2023

Higher interest rates are impacting homeowners more than home buyers.  New listings were down by about 1/3 as compared with April 2022.

Sellers are getting more than their asking price and houses are selling in less than 30 days. The demand for houses remains higher than the supply, although the supply did go up to 1.5 months from 1.4 months earlier this year.  There is a 1.6-month supply of homes currently for sale in the seven-county metro area.

Prices usually peak in the metro area in April. We won’t have those numbers until May. Average mortgage rates on a 3o year mortgage are at around 6.4%.

If you would like to know how much your home will sell for call or write for a free no obligation market analysis.
March Home sales in Minnesota

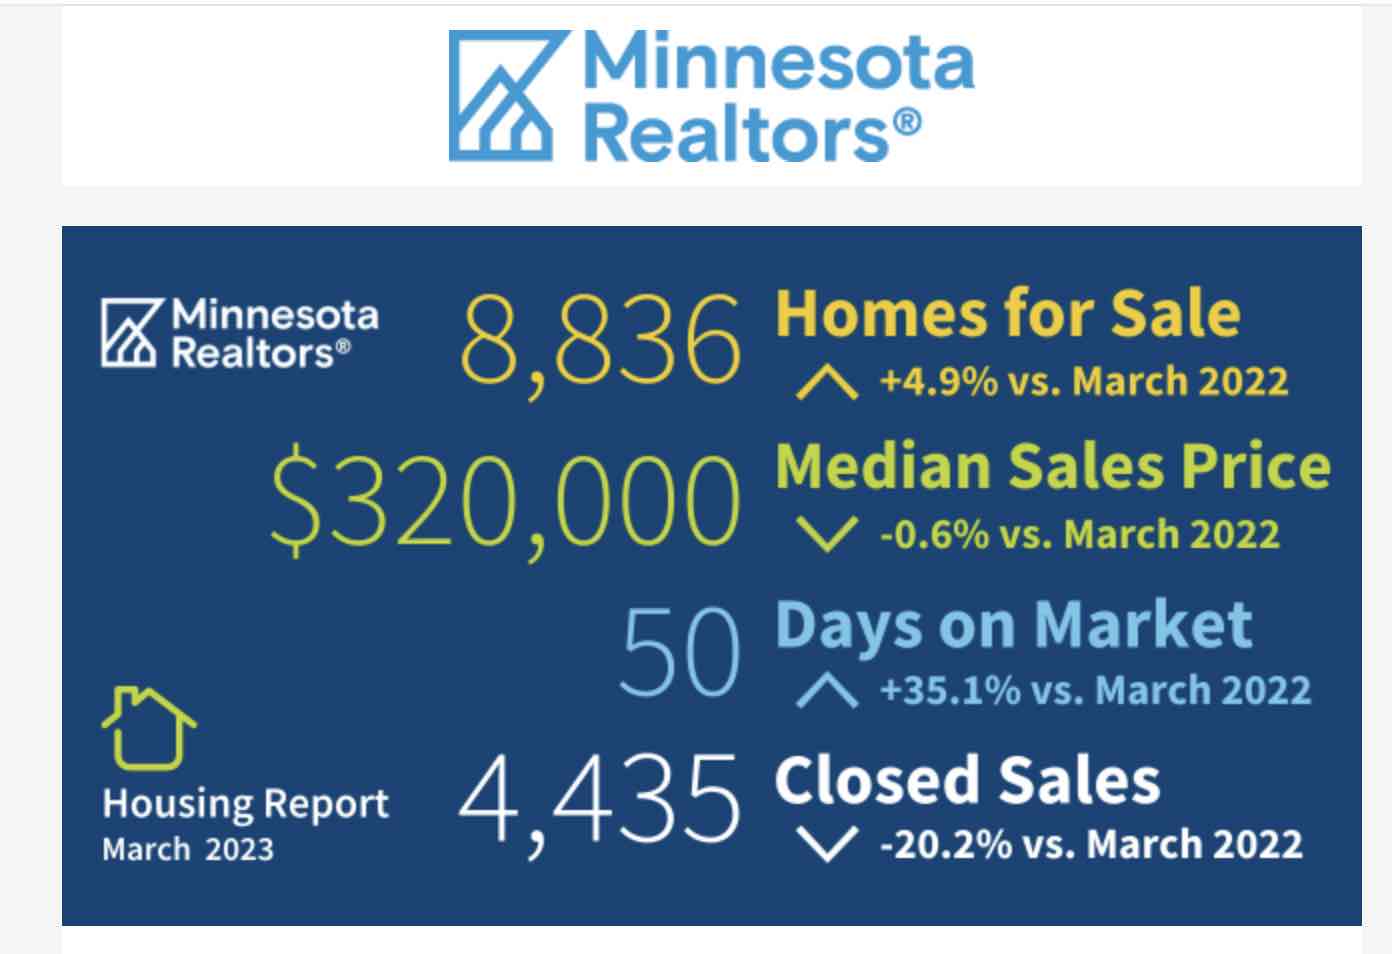
This just in from Minnesota Realtors, which is the state association of Realtors. Each month they publish a report on home sales in the state.

March home sales
March Home Sales in Minnesota

The inventory of homes on the market remains low but is slightly higher than it was last year at this time.  Houses stay on the market 35% longer than they did last year at this time.  Median sales prices are down slightly from what they were a year ago.

Closed sales are way down from a year ago. A 20% decline is significant. Fewer people are interested in selling probably due to higher interest rates.

Home prices in the 7 county Metro area rose by 6.5% in March as compared with last March. The average days on market was 32 which is up 23% from last year.  Pending sales were down 23% from March 2022 and the number of houses on the market is up 12% from last year.

mini spring home sales rush

I like the word “mini” when describing the housing market in St. Paul. It gets a little smaller every year. During March we experienced a kind of spring rush as activity increased in the housing market. Nationally February marked the third straight month of an increase in pending home sales. I’ll predict that March will be the fourth but it won’t be reported by the national news until May.

This is why I like to get numbers together a few days after the end of the month. The numbers still lag a bit because most of the home sales that closed in March were initiated in February or even January.

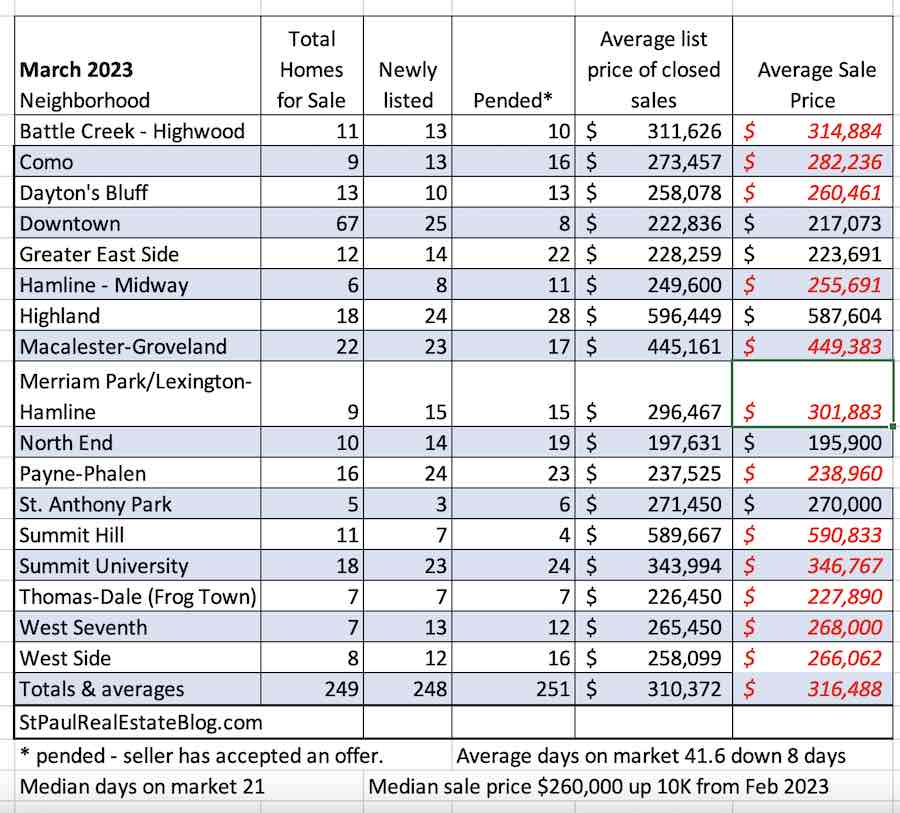
In St. Paul, the amount of time it takes to sell a house is down from last month and the average and median home sale prices are up from last month.  It feels like a spring rush because pending sales are way up from last month, and overall sales prices are higher than asking prices.

The table below shows home sales for March in St. Paul neighborhood because real estate really is that local.

table showing home sales and prices by neighborhood
March 2023 home sales – St. Paul, MN

The data used in this report was extracted from the NorthstarMLS which is deemed reliable but not guaranteed

For more local real estate numbers please see Local market conditions and home prices.


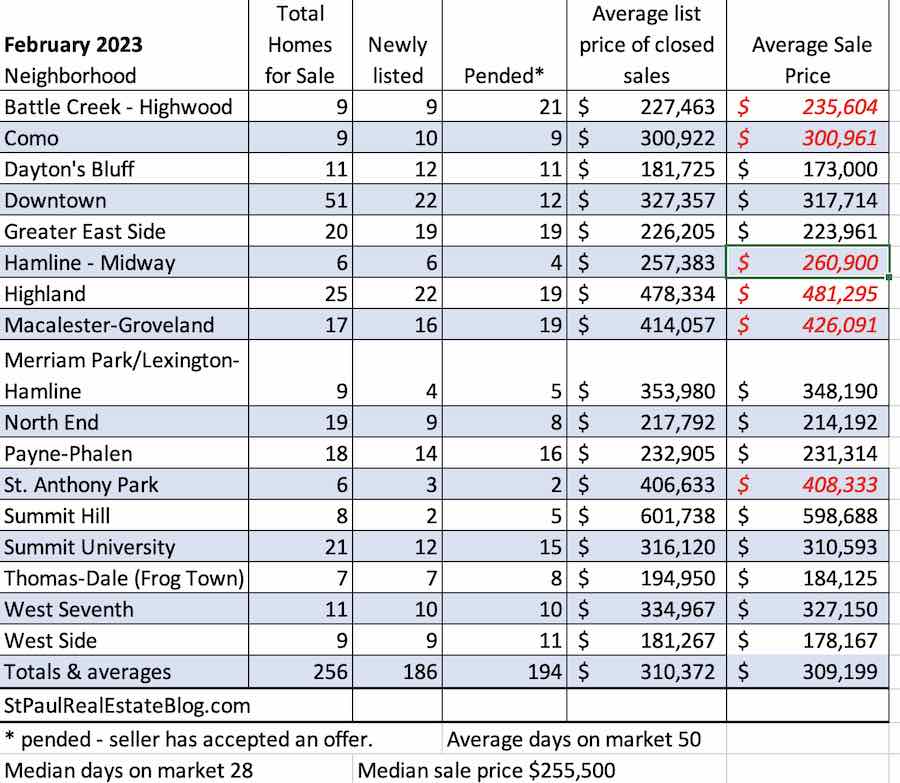
Home sales and prices for February 2023

There are more houses on the market right now than there were a year ago but it is fair to say that the seller’s market that we have been seeing for the past few years is as strong as ever.

Houses are staying on the market longer but they are still selling in less than 50 days in most cases. Prices are still going up but much more slowly and hesitantly than what we saw in 2020, 2021, and much of last year.

The closed sales prices reflect January activity more than February activity as there is usually a 30 lag between when an offer on a house is accepted and when the sale closes.

Interest rates and weather are both contributing to slower home sales.

The numbers used to create the table below are from the NorthstarMLS which is deemed reliable but isn’t guaranteed. The majority of the homes that were sold in St. Paul in February were listed on the NorthstarMLS (multiple listing service)

table that shows home prices by neighborhood
February home sales by St. Paul neighborhood

In the Twin Cities, the housing market usually starts to peak in mid-March as far as the number of sales and the prices.  It will be an interesting Spring with higher interest rates and high demand and low supply of houses on the market.

January home sales down 33% from last year

Here is a look at January home sales In Minnesota.

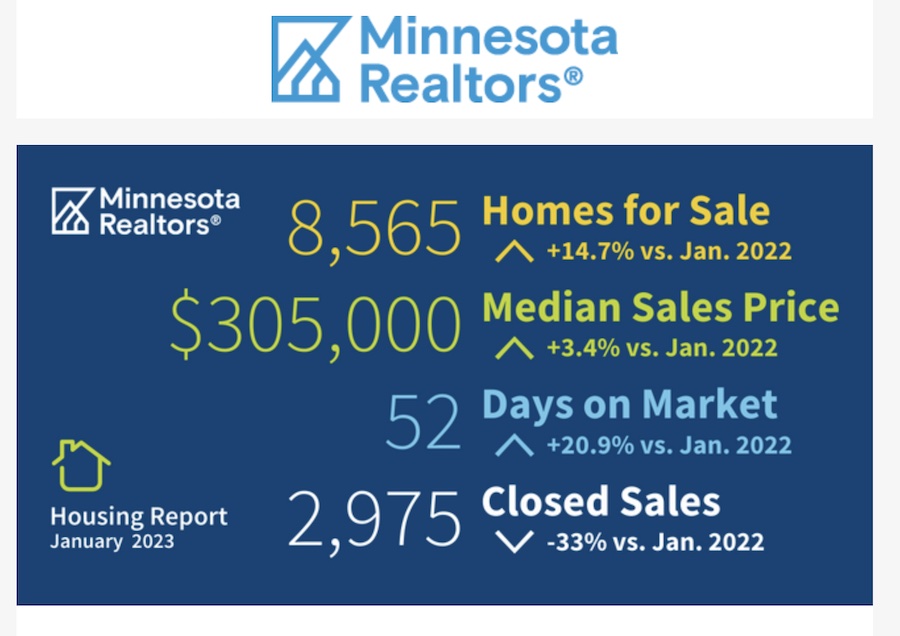
The housing market continued to normalize as closed sales for January declined 33% compared to the cooling, though still robust market of a year ago. New listings were also down 12.4% across the state, with just under 4,300 properties becoming available. Although mortgage interest rates fell to 6.09% by the end of January—the lowest since September 2022—home buyers struggled with affordability.
“The median sales price was up 3.4% over last year, increasing to $305,000. This slowed demand as the average number of days a home remained on the market swelled almost 21% to 52 days. Consequently, home sellers were accepting slightly smaller offers, receiving over 95% of their asking price compared to almost 99% in January 2022. With slower-moving sales, the overall number of homes for sale increased by almost 15% to 8,565.” [Minnesota Realtors]
Minnesota Home Sales January 2023
Minnesota Home sales January 2023

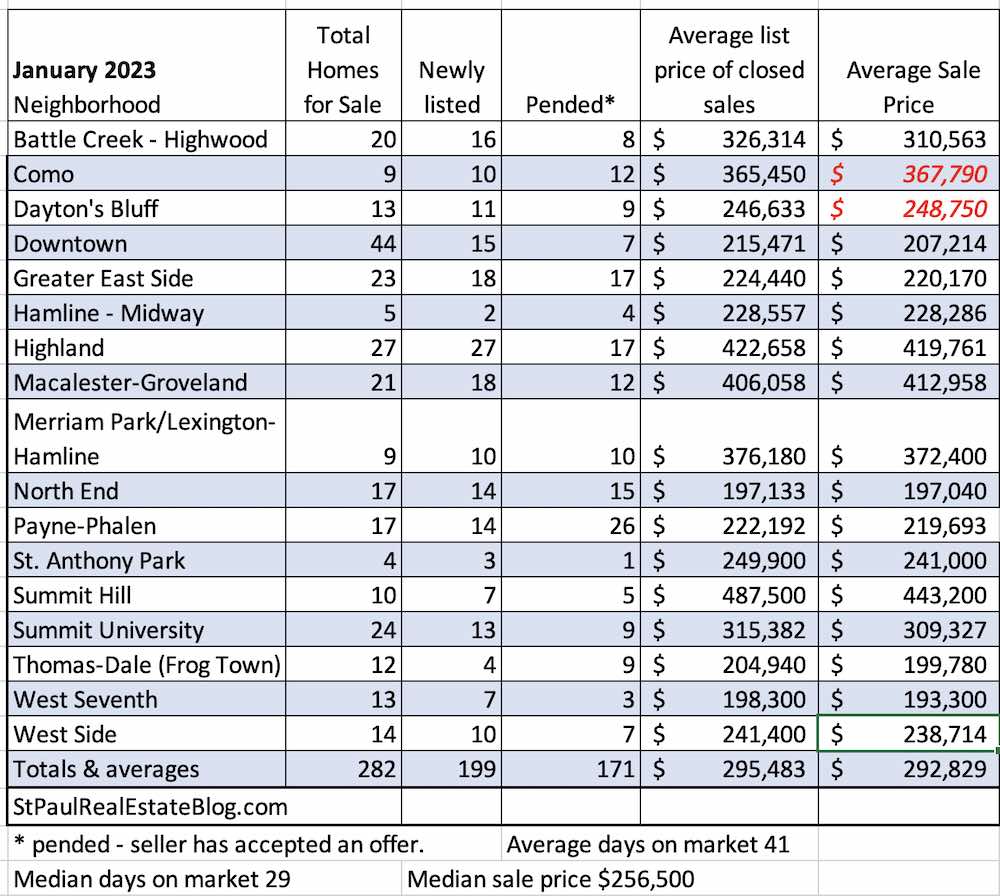
January 2023 home sales

In most cases, January home sales reflect December activity. We had some cold weather in December and that does affect the housing market.  The Christmas holidays have an impact too.

The number of new listings reflects January listings. A smaller-than-expected number of homes went on the market in January and the inventory of homes on the market is very low.  A smaller inventory usually means higher prices and always means fewer sales.

The numbers are from the NorthstarMLS which is deemed reliable but not guaranteed and also the source of listings for numerous websites where buyers can search homes for sale.

I like to show the numbers by neighborhood because real estate is that local and I specialize in St. Paul real estate.

Table that shows the number of home sales in St. Paul
Home sales in St. Paul for January 2023