August 2023 home sales in Minnesota

Sales continued to soften in August, but home prices showed their largest year-over-year gain in over 12 months. Many would-be sellers are choosing to stay put for now. Most sellers are also buyers, and higher mortgage rates combined with higher prices have truly harmed affordability.

MNR President Emily Green said, “We’re seeing people stay in their homes longer, particularly if they have an attractive mortgage rate. Some call this the ‘lock-in effect’ and it’s preventing needed inventory from hitting the market.”

August Year-Over-Year Summary of Key Market Indicators: 

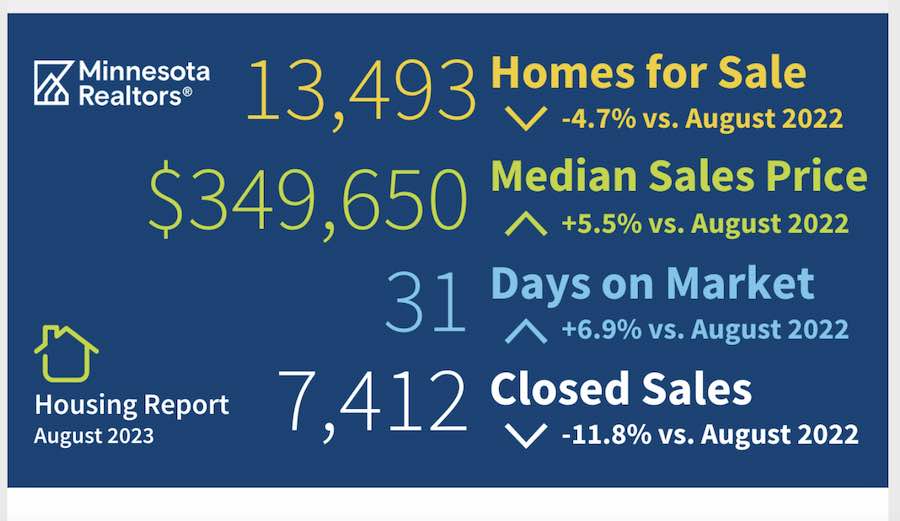
  • Closed sales: 7,412 (down 11.8%)
  • Median sales price: $349,650 (up 5.5%)
  • Average sales price: $408,107 (up 6.3%)
  • New listings: 9,124 (down 0.4%)
  • Pending sales: 6,806 (down 10.6%)
  • Days on the market: 31 (up 6.9%)
  • Homes for sale: 13,493 (down 4.7%)

In September the number of homes on the market is higher in the metro area than it was in August but still very low.
August home sales in Minnesota
August 2023 home sales in Minnesota

Low inventory the new normal for a decade

Back when I first started selling residential real estate we were taught that a six-month supply of homes on the market is a balanced market.  A balanced market is one that doesn’t favor buyers or sellers.

We measure absorption rates, and supply by how many months it would take to sell all of the housing that is currently on the market, based on recent data on how many homes are sold each month. We can also call it supply and demand.

During the housing crash in the late 00’s we experienced a strong seller’s market. The supply of houses for sale as measured in months was often in the double digits.

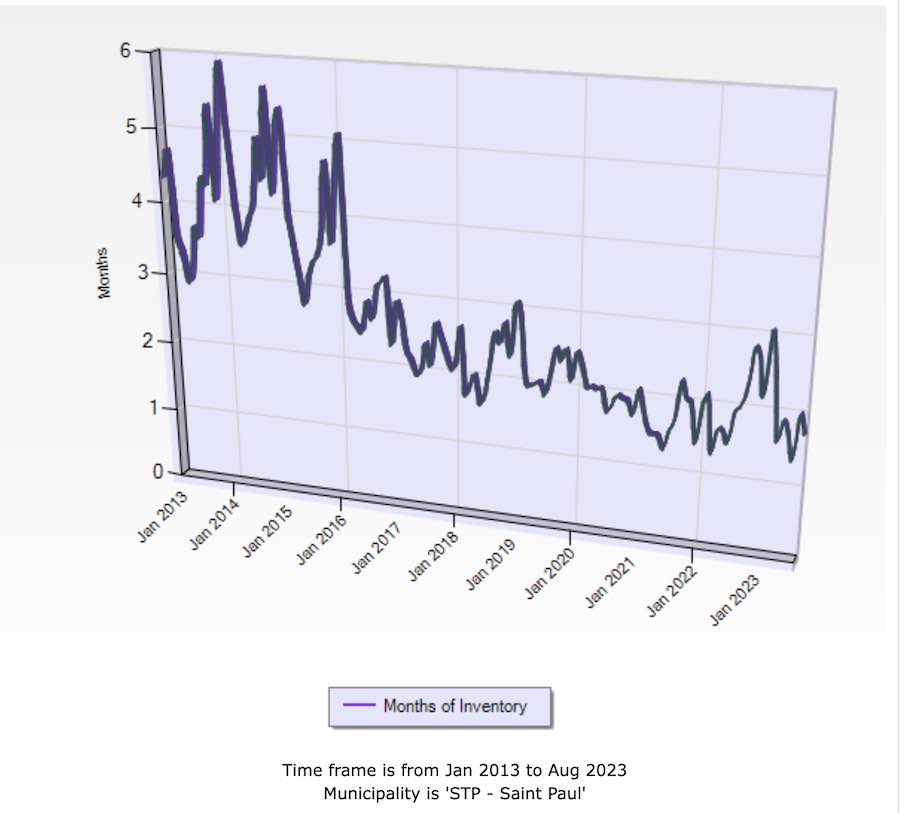
Right now there is less than a two-month supply of homes for sale in the Twin Cities metro area. For most of the last decade, we have experienced a seller’s market. That isn’t going to change anytime soon.

With the high home prices and high mortgage interest rates, there is one bright spot. Rents are starting to level off and even go down. Now if we could just build some affordable housing life would be grand.

Limited housing hampers economic growth. Companies cannot attract workers if there isn’t enough housing or if it is too expensive.


chart shows housing supply
Housing supply in St. Paul for the last 10 years

We can usually predict just how long a specific house will take to sell based on recent data. It varies by city, neighborhood, and price.

August 2023 Home sales

There wasn’t much on the market in August but what there was sold quickly and for more than the asking price even though interest rates have averaged about 7% all month.

Buyers are buying. Inspection contingencies are back. Sellers who have low mortgage interest rates are hanging on. That means fewer homeowners are selling.  There are always people who have to sell or want to sell.  That is why there are always houses on the market.

There are cash buyers out there too.

If you are planning on selling this year make sure everything in your house is in good condition because buyers are having inspections and asking for repairs.

As we have seen for the last several years housing costs are still rising. Rents seem to be stabilizing and according to some are even going down. We shall see.

The numbers used to make the chart were extracted from the MLS and they include data for all single-family homes in St. Paul that are or were listed in the Northstar MLS in August. The data represents a high percentage of houses that were sold or are for sale and the data is deemed reliable but it isn’t guaranteed.

table that shows August home sales in St. Paul
St. Paul home sales August 2023

Sale prices were higher than listing prices last month which means home prices are still rising. The median home sale price is down slightly and to be honest I am not sure what that means.

For more local numbers please see Local market conditions and home sale prices.

If you would like information about how much your house might sell for contact me for a free no obligation accessment. If you want to talk to several Realtors and home buyers about your house post a message on Facebook and see what happens.

fewer houses for sale in 2023

I have been writing about this for months. When the interest rates went up the number of homes on the market went down. Homeowners would rather stay put than move up to a higher interest rate. Thirty-year mortgage rates have risen to a 22-year high, at an average of 7.23% according to Freddie Mac.

So far home buyers have been willing to pay higher rates.


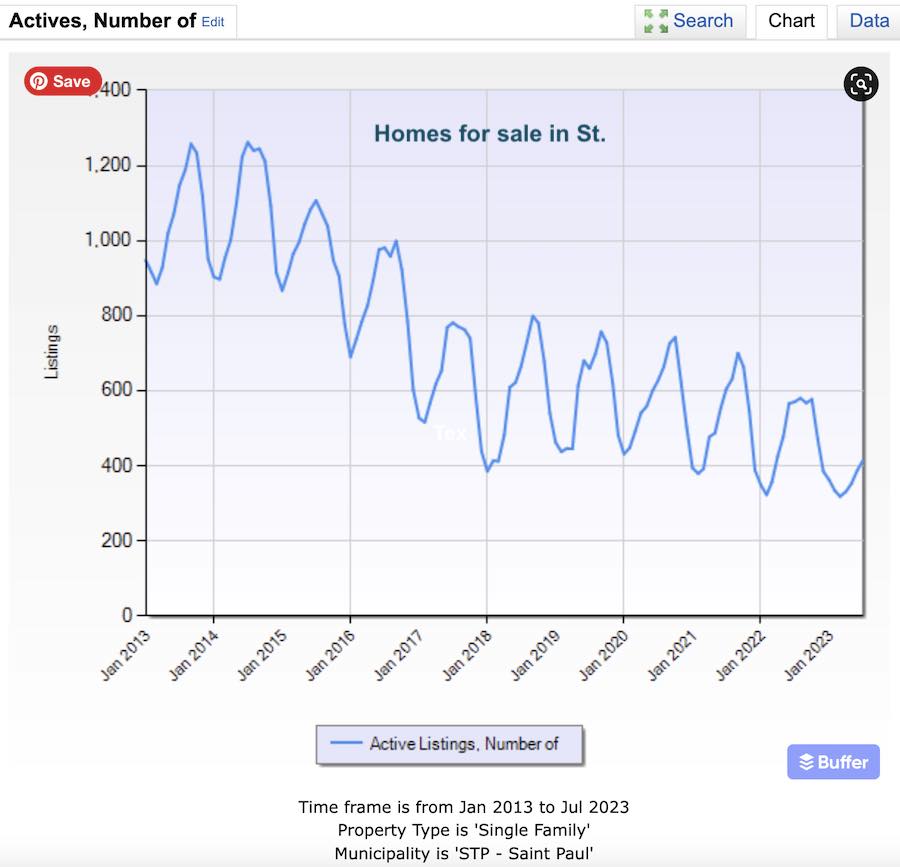
homes for sale in St. Paul
Homes for sale St. Paul

The peaks and valleys on the chart are there because home sales are somewhat seasonal. There are more on the market during the spring and summer than during the winter.

July 2023 Home sales in St. Paul

In July 2023 we saw home prices rise in spite of higher interest rates. The demand for housing remains strong and at the same time the supply remains low as homeowners are reluctant to move and give up those low interest rate mortgages.

It still takes less than a month to get an offer on a house. This is a great market for home sellers who are in a hurry. 🙂

This is also a great time to sell a house and buy a condo in downtown St. Paul where sale prices are lower and the inventory of homes for sale is higher.

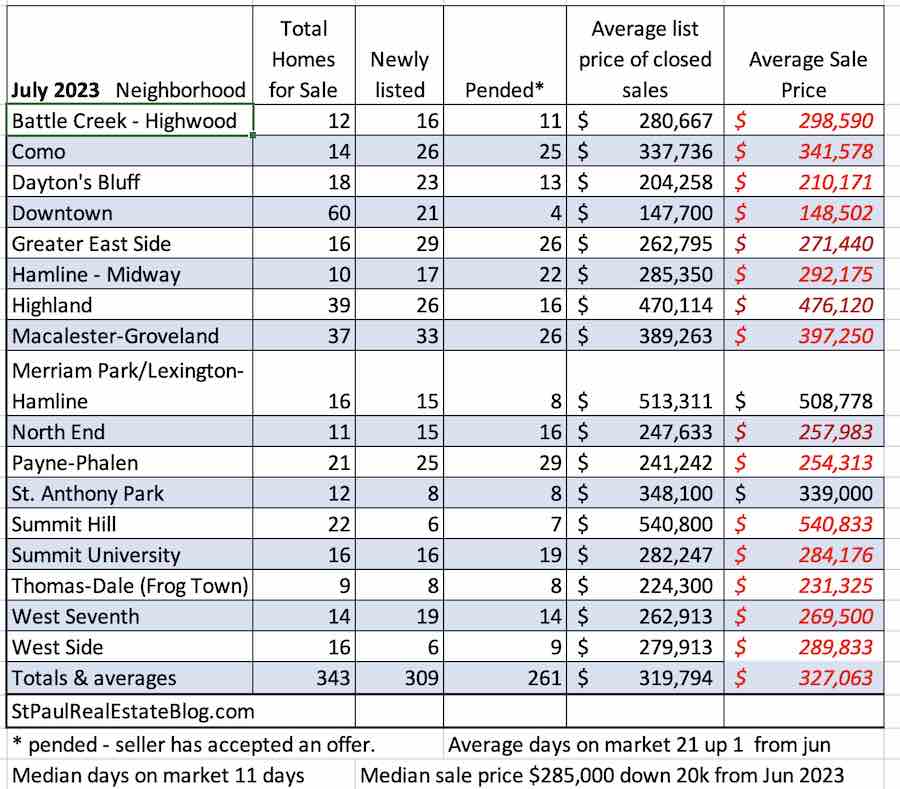
table that shows home sales and prices by neighborhood
Home sales and prices by St. Paul neighborhood for July 2023

The numbers used to make the chart were extracted from the NorthstarMLS. The data is considered reliable but is not guaranteed. There are few guarantees in life.  I should have more numbers this week at they are reported by various Realtor associations and government entities. Happy Monday!

Interest rates up again

I know I wrote about how rates were headed in the right direction. They did go down a little but after last week’s rate hike by the federal reserve, they went up to 6.81% for the 30-year conventional mortgage. (Freddie Mac)

That is high, especially considering how expensive houses are. Last week I was talking with some older homeowners who pointed out that when they bought a house rates were over 8%. At the time one of them had a job that paid $3.50 an hour and the house cost $15,000.  The house cost about the same as two years’ income.

The table below shows how much income is needed to buy a house in Minnesota. The numbers are provided by Minnesota Housing Agency.

Household Size 11-County Twin Cities Metro Area* Dodge and Olmsted Counties
1- 2 Person $89,000 $89,000
3 Person $101,000 $101,000
4 Person $112,000 $112,000
5 Person $121,000 $121,000