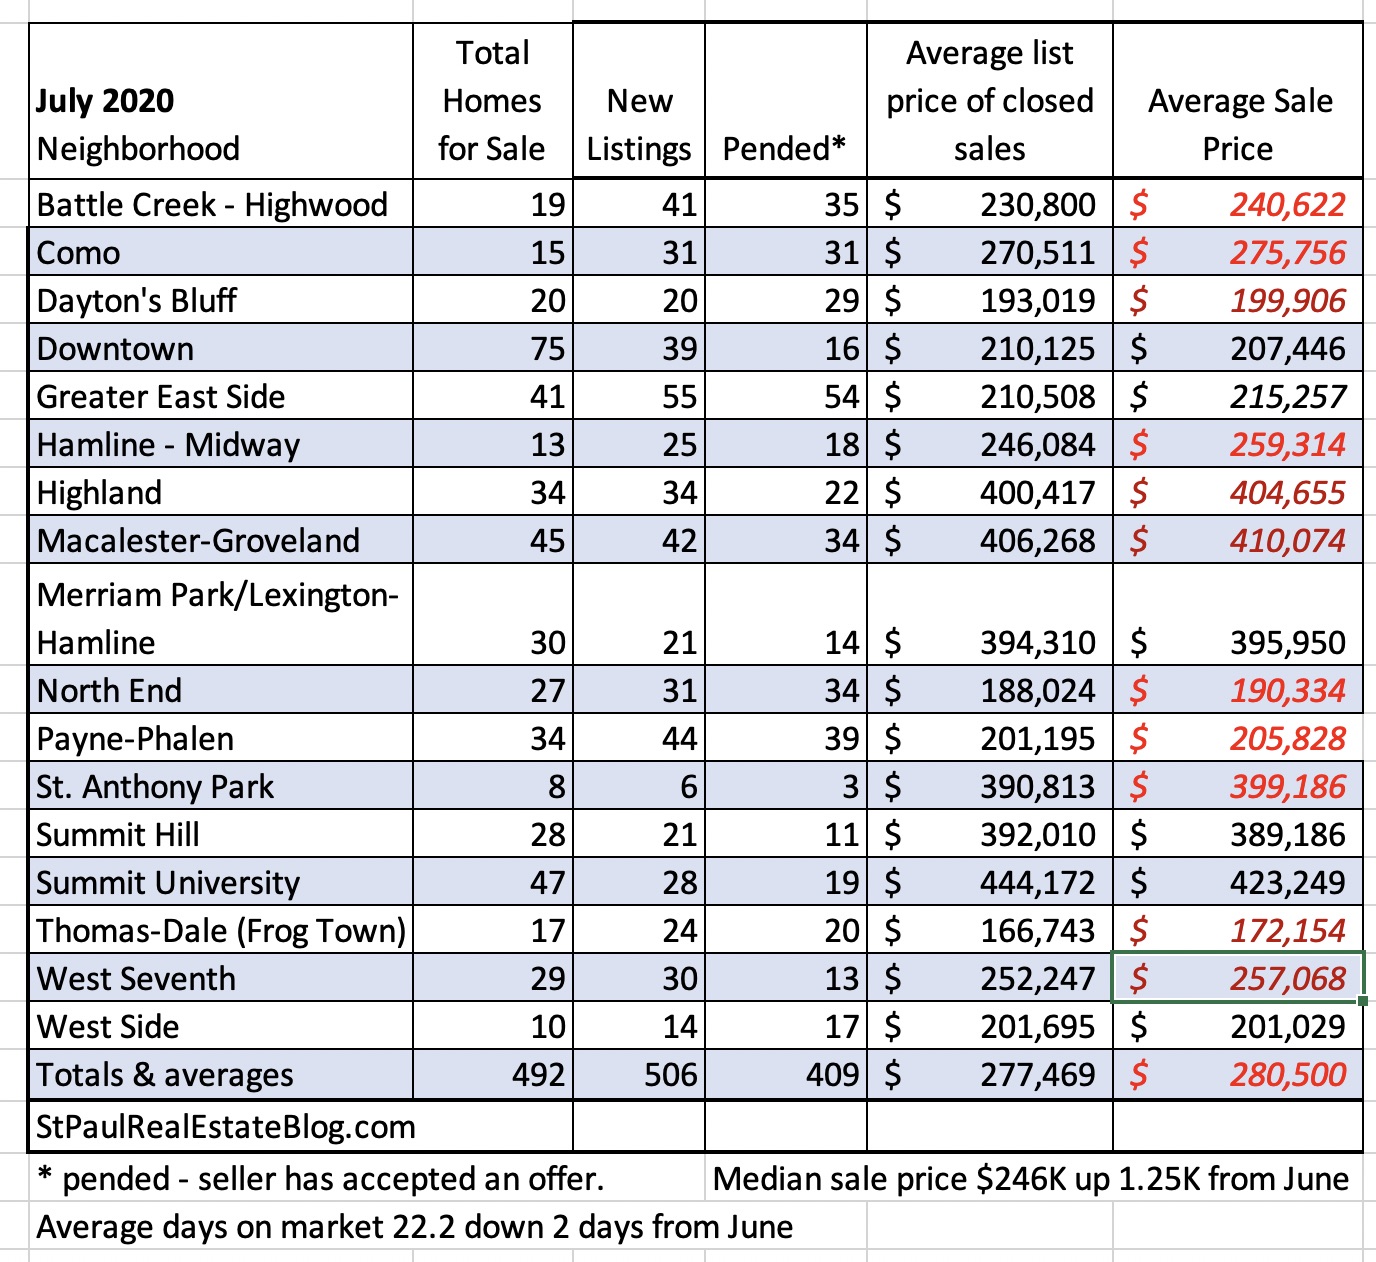
July home sales in St. Paul look kind of Juneish. Yes, I made that word up but my point is that the increase in homes for sale and sales look like what we normally see in June.
The average sales prices were higher than the average list prices in many neighborhoods. That means prices are going up not down.
The market still favors sellers. This is a great time to sell but it is still a tough time for buyers who get caught up in multiple offer situations.
The average number of days on the market is down from last month, sale prices are up. The number of new listings is up and pending sales are up too.
Real estate is local and recent data is more relevant than old news. Your uncle Fred who lives five states away and who has not bought or sold real estate in the last 20 years might be giving you bad advice.
The numbers used to make the chart were extracted from the NorthstarMLS and are deemed reliable but not guaranteed. No numbers were harmed in the process and there were gently sorted in MS Excel but never stirred.
For more local home sale data see Local market conditions and home prices
If you would like to know how much your home might sell for contact me and I’ll provide a fast free no-obligation estimate. (Also called a CMA)
