Maybe there is a new normal in the housing market but there is still some of the hold normal too. Here in the Twin Cities real estate sales are seasonal. In the last couple of years the good old US government has tried to stimulate the housing market with tax incentives and well it didn’t do any good except it put a few kinks in the normal seasonal home buying curve.
This chart is from a report I created in book a showing. It shows home viewing activity by month for the metro area. There is a direct correlation between home viewing and home buying. Buyers generally see homes before they buy and the more home viewings there are in a month the more home sales there are the next month. It should be noted that the inventory of homes on the market is lower right now than it was in 2009 or 2010 which will affect the number of showings but should not impact the shape of the curve.
This chart shows the seasonal home sales curve. It looks like this year is a little more old normal than new normal.
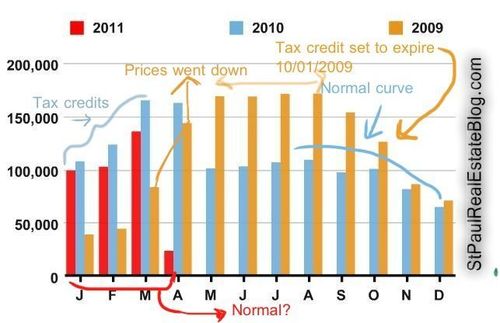
three year comparison of home showings
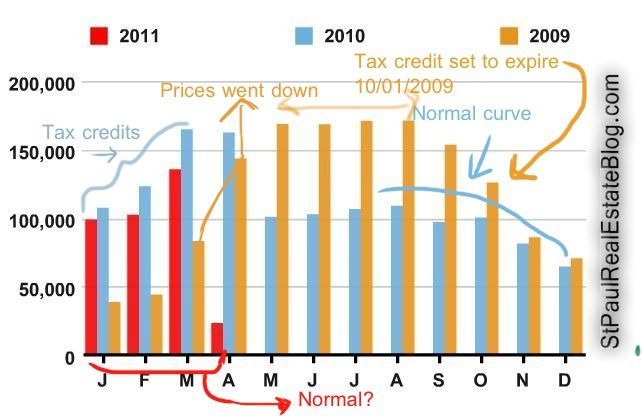
Home buying activity is always the highest in the middle of the year and usually the lowest at the end of the year. This year there are no special tax incentives for buying a home but prices have gone down and so have interest rates and it is starting to look a little more like 2009 which was more like the old normal than the new normal.
