St. Paul Homes Prices & sales by neighborhood

 It is Monday and I have some real estate numbers for St. Paul Minnesota because real estate is local and I like numbers.  

The numbers used to make the chart came from the Northstar MLS and are deemed reliable but not guaranteed.  I did not take any of the numbers I just borrowed them.

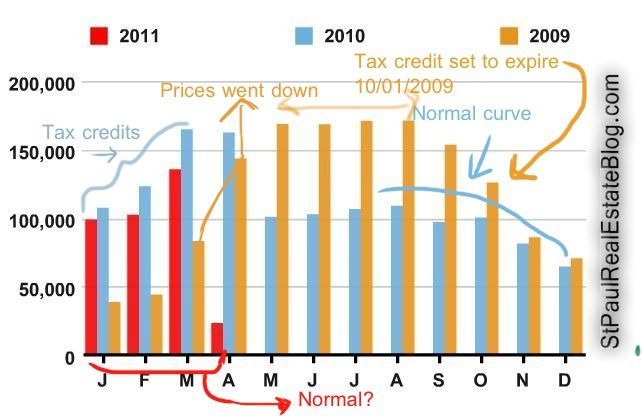
December is the slowest month of the year for home sales and prices are usually the lowest of the year.  Median prices in St. Paul were $104,500 for December 2011.  

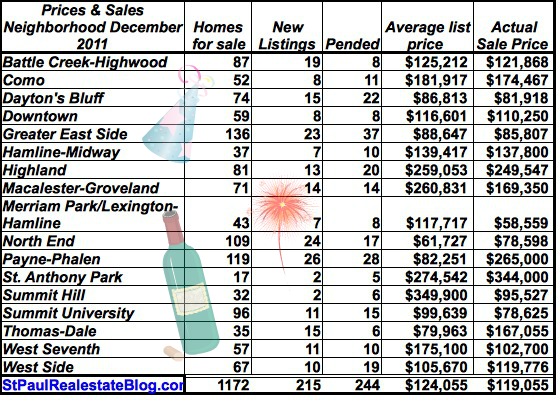
For the first time since in many years but I do not know how many there was more buying going on in our market than selling.  The number of pending sales is higher than the number of homes that were listed.  This is great news for home sellers.  
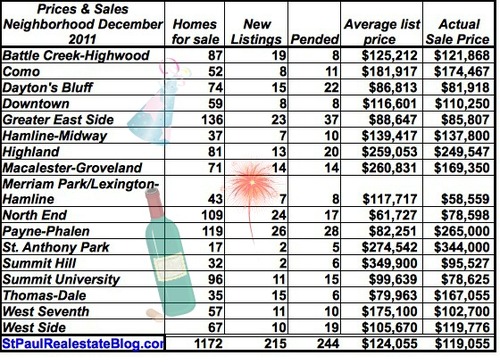
december2011
December 2011

The inventory of homes on the market is very low and buyers are having a hard time finding that perfect home.  I have been watching every day for new listings for my buyers which is something I have not had to do in years.

I anticipate an increase in homes on the market and an increase in buying activity because we almost always see more activity in January than in December.  

For more numbers like these please see local numbers and market conditions.

Absorption rates

 
Absorption rates are a calculation of how long it will take for all the

cotton swabs
cotton swabs

 homes on the market to be sold, or absorbed, at the current rate of homes sales and with the current number of homes on the market.  The numbers tell us if we are in a buyers market or a sellers market.  I do love numbers and these numbers are in months, the data used came from the RMLS, (MLS) and is deemed reliable but not guaranteed. Sadly there are no guarantees in life. These are for the seven county metro area which is like the 13 county metro area except smaller and are for the last 30 days.

Anoka County 5.1 Months
Carver County 6.3 Months
Dakota County 4.7 Months
Hennepin County 3.1 Months
Ramsey County 5.7 Months
Scott County 5.1 Months
Washington County 5.0 Months

We are at the cotton swab stage where there is really very little inventory to absorb. . . yet it does not feel at all like any sellers market that I can remember.   Absorption rates were at the qtip level last April as well. 

For related posts see Local Market Conditions and Home Prices

Home prices & sales by neighborhood

march2011
march 2011

Monday is a great day for posting some local housing numbers because it is not Tuesday.  The chart above was made from numbers from our local MLS for St. Paul, Minnesota for the month of March 2011. The data is deemed reliable but not guaranteed but there are few guarantees in life.

Not much has changed since last month.  Prices are up very slightly. Pending sales were up over February 2011 but it should be noted that February is shorter than March and that does account for a few sales.

The only thing these numbers really tell me is that the housing market it fairly stable.

For more numbers like these please so the Local Market Conditions & Home Prices Category.

is there a new normal?

 Maybe there is a new normal in the housing market but there is still some of the hold normal too.  Here in the Twin Cities real estate sales are seasonal.  In the last couple of years the good old US government has tried to stimulate the housing market with tax incentives and well it didn’t do any good except it put a few kinks in  the normal seasonal home buying curve.  

This chart is from a report I created in book a showing.  It shows home viewing activity by month for the metro area.   There is a direct correlation between home viewing and home buying.  Buyers generally see homes before they buy and the more home viewings there are in a month the more home sales there are the next month.  It should be noted that the inventory of homes on the market is lower right now than it was in 2009 or 2010 which will affect the number of showings but should not impact the shape of the curve.  

This chart shows the seasonal home sales curve.  It looks like this year is a little more old normal than new normal. 

home showing chart
three year comparison of home showings 

Home buying activity is always the highest in the middle of the year and usually the lowest at the end of the year.  This year there are no special tax incentives for buying a home but prices have gone down and so have interest rates and it is starting to look a little more like 2009 which was more like the old normal than the new normal.