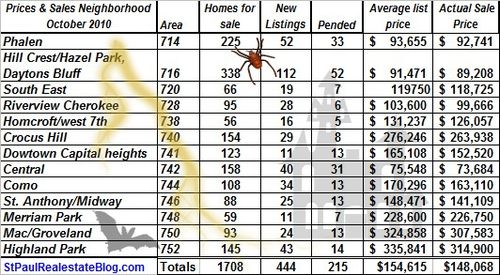
October numbers are the most fun because I get to use a Halloween motif on the chart which would be an appropriate motif on most any chart related to home sales. The number of homes on the market and the number of new listings is down from September but the reason for it is seasonal so it doesn't mean much. Home prices went up ever so slightly this month. The average for days on the market for the homes that closed in October was right around 115 days.
Interest rates are going up slightly. The number of foreclosures on the market is also going up.
For more numbers likes these please see Local Market Conditions & home prices
I was gone for a few days and ended up being out of town longer than expected. My flight way delayed by 14 hours and I ended up spending a night in Philly, on my way back from New Orleans.


Hey,
Just happened to stumble onto your site when looking at other realtor’s blogs. I really like the way you created a condo directory and how creative you area with your market statistics. Keep up the good work – really original!
Cheers,
Ryan