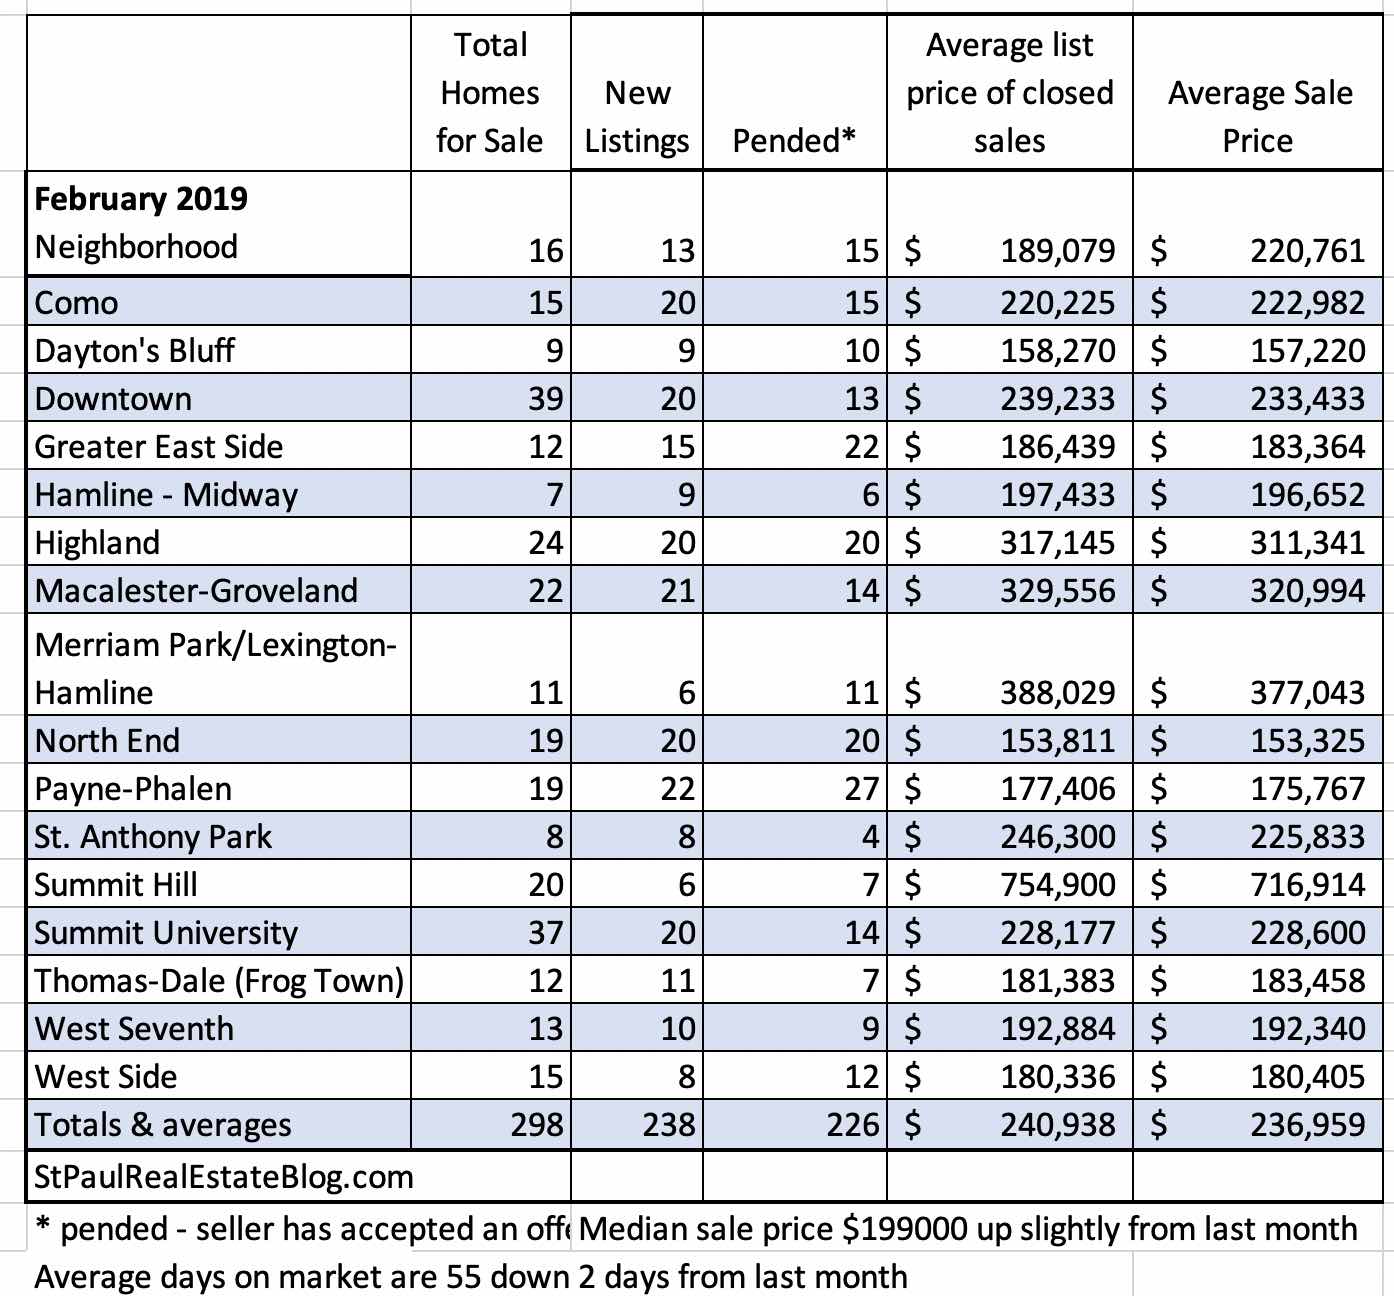
I have numbers for February home sales in St. Paul. I think that is a great way to start the week. The number of homes on the market is decreasing as buyers are snatching them up. The absorption rate went down from 1.8 months in January to 1.7 months in February.
The absorption rate last February was 2.3 months which could mean that buyers will face more competition this year. Average sales prices went up less than $200 from the previous month and the time it takes to sell a home went down by two days to an average of 55 cumulative days on market.
Home sales in St. Paul are influenced by the seasons. We should start seeing more listings as we head into Spring and there will be more buyers out and about too.
The data used to make the table was extracted from the NorthstarMLS which is considered reliable but not guaranteed. Once extracted the numbers are gently sorted and subtotaled using a spreadsheet. The data is never shaken, stirred or harmed in any way.
For more local real estate data please see Local Market Conditions & Home prices
I have been gathering this data and publishing it since your real estate agent was still in high school. 🙂
