I am a little late with February home sales data for St.Paul. There have been too many distractions. Overall the demand for homes in St. Paul is as strong as ever and the strong seller’s market isn’t showing any signs of weakening.
Average prices were up from January and so were the number of new listings.
Here is a look at numbers and activity for each neighborhood because real estate is that local.
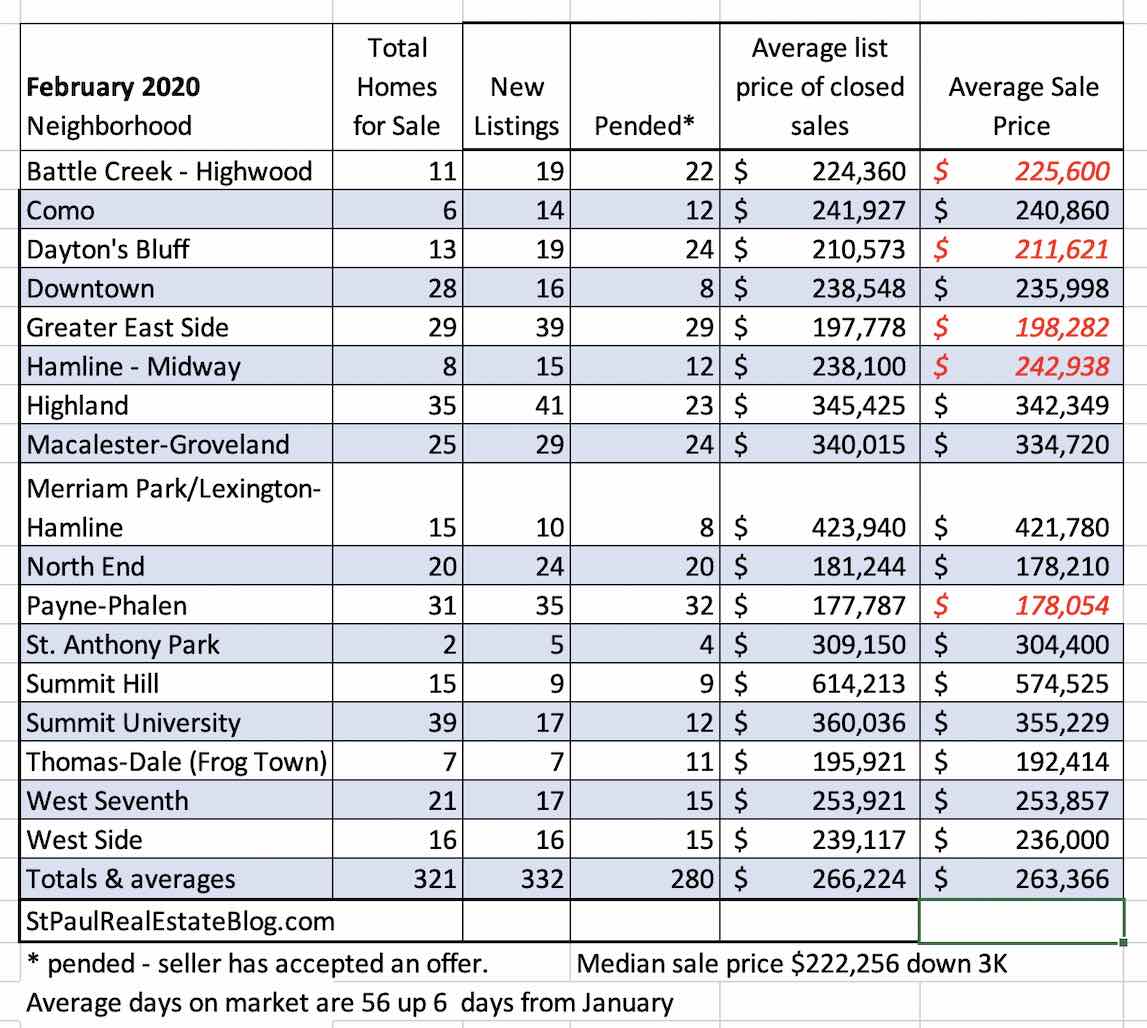
The sales prices that are in red indicate that the average sale price was higher than the average list price. As we go into spring and summer we will see average sale prices rise and more red numbers on my table.
The numbers I used are from the Northstar MLS and are deemed reliable but not guaranteed. They have been gently sored in an MS Xcel spreadsheet and never stirred or shaken. They include single-family homes and condos sold within the city of St. Paul which doesn’t include Eagan and Maplewood which are often lumped in with St. Paul by the large national real estate sites.
For more local numbers and we go way back to 2005 please see Local market conditions and home prices. Look for March home sale numbers in the first week of April unless I forget.
