It has been an interesting year, with the number of homes on the market increasing, while at the same time the numbers of homes sold each month decreased.
It is important when looking at these numbers to compare at least two years worth of data because there are seasonal variations in home sales every year.
The biggest change in the past year has been in the number of days homes are on the market before someone buys them. The supply and demand ratio is currently at about 11 months, in January of 2006 , the supply and demand ratio was at 5.58 months. The data used to make the charts comes from the MLS and is for the entire Twin Cities area. Average sold prices and supply and demand ratios vary by neighborhood.
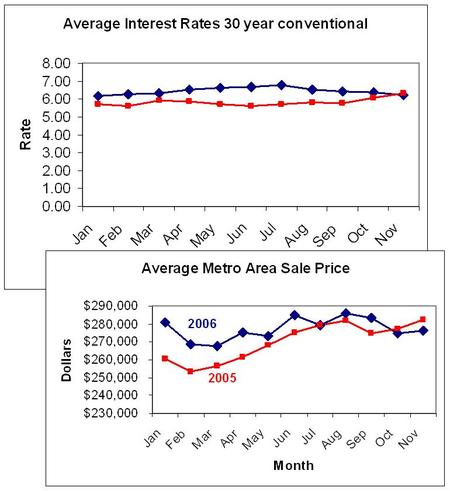
What about prices? The average sale price for a home located in the twin cities metro area in January 2006 was $280,961, in January of 2005, the average was: $260,269. For November 2006, the average metro sales price was: $276,061. Up from 2005 prices, but down slightly since the beginning of the year. Interest rates, according to the Freddi Mac weekly survey of average interest rates on 30 year conventional mortgages remained fairly flat in both 2005 and 2006.
 The data used to make the chart of average metro area prices comes from the MLS and is for residential listings in the Twin Cities area.
Watch for St. Paul year end neighborhood numbers the first week in January.

