St. Paul Home Prices and sales by neighborhood

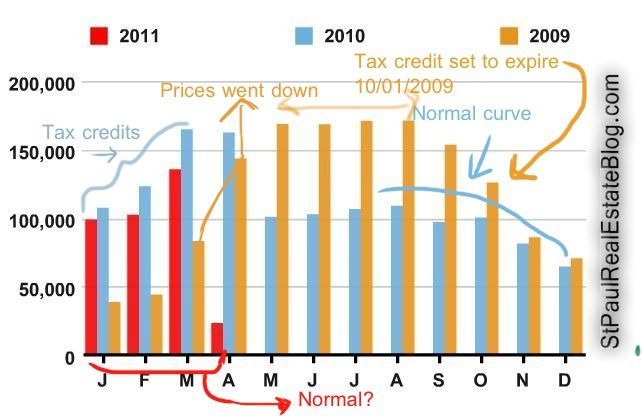
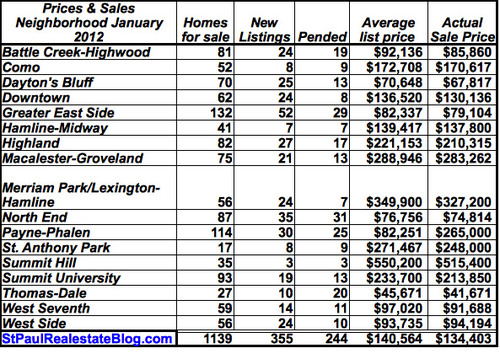
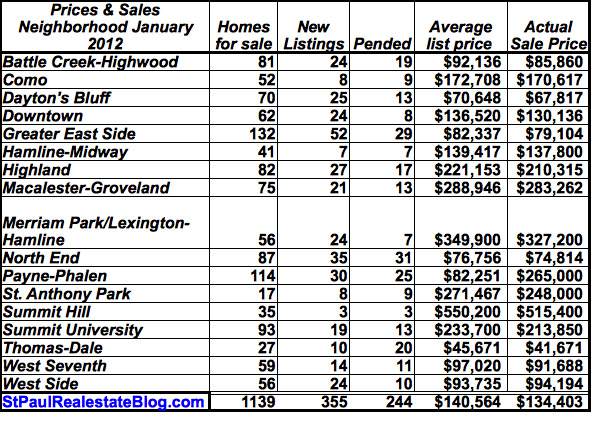
 I am not sure how it happened bur I missed January which is weird because it is a big cold month and hard to miss.  here are some statisitcs for January home sales in St. Paul, Minnesota.  

The data used to create the chart comes form the North Star MLS.  The data is deemed reliable but not guaranteed.   We will have numbers for February sometime next week.

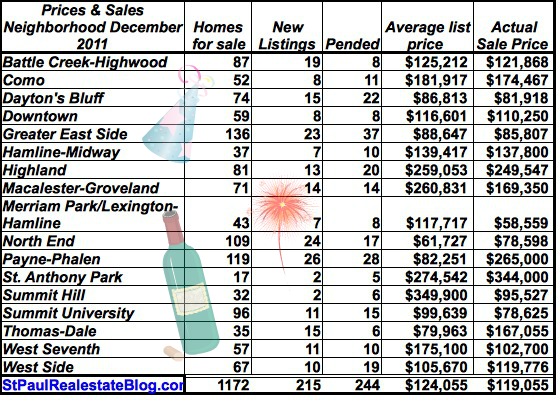
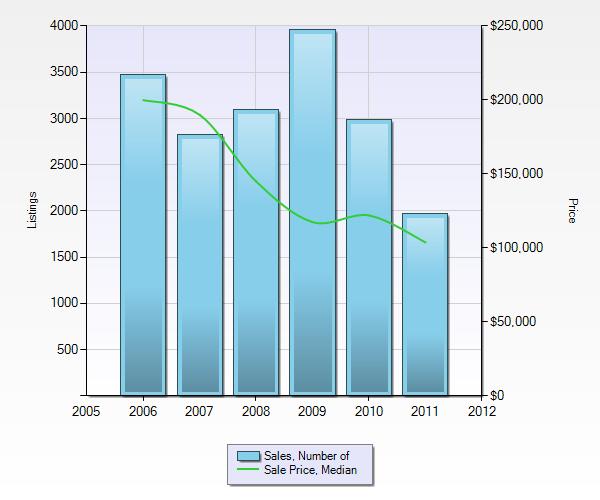
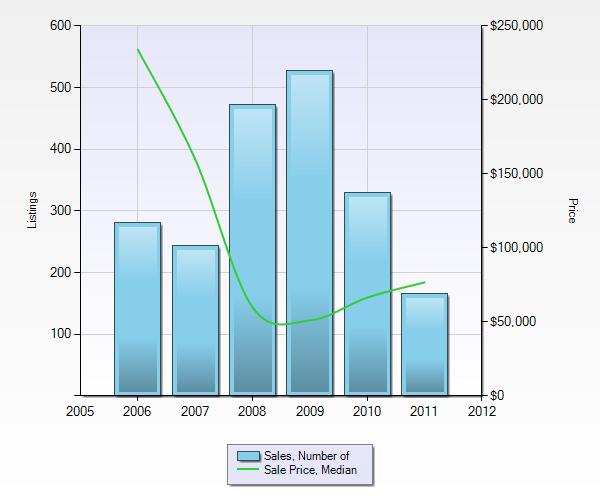
Home prices are about what they were in January of 2011.  The number of home sales is up from a year ago but about the same as it has been for the past three months.  Real estate is local and these numbers may not reflect what it going on in your area.

The inventory of homes on the market continues to decline, there are about 25% fewer homes on the market today than there were a year ago.  Prices are being held down by sluggish demand and the large number of below market value foreclosures on the market.  

jan2012
January 2012

For more reports and local real estate numbers check the Local Market Conditions & Home prices category. 

St. Paul Homes Prices & sales by neighborhood

 It is Monday and I have some real estate numbers for St. Paul Minnesota because real estate is local and I like numbers.  

The numbers used to make the chart came from the Northstar MLS and are deemed reliable but not guaranteed.  I did not take any of the numbers I just borrowed them.

December is the slowest month of the year for home sales and prices are usually the lowest of the year.  Median prices in St. Paul were $104,500 for December 2011.  

For the first time since in many years but I do not know how many there was more buying going on in our market than selling.  The number of pending sales is higher than the number of homes that were listed.  This is great news for home sellers.  

december2011
December 2011

The inventory of homes on the market is very low and buyers are having a hard time finding that perfect home.  I have been watching every day for new listings for my buyers which is something I have not had to do in years.

I anticipate an increase in homes on the market and an increase in buying activity because we almost always see more activity in January than in December.  

For more numbers like these please see local numbers and market conditions.

Prices & Homes Sales by St. Paul Neighborhood

Here are the August numbers for St. Paul home sales.  The good news people like to compare this past August with August of 2010 which was one of the worst months since the housing crash began.  We had a slow summer last year after the tax credits expired because when they were in effect all they did was encourage people who were ready to purchase a home to do it at the beginning of the year.  

Home sales this August are up slightly from July which is fairly unusual and a good sign . . I think and up by almost 30% from August of 2010 which doesn’t mean much but it is the good news everyone is looking for.  Home prices went down slightly from what they were in July.  The Median home price in St. Paul for August 2011 was $102,448.  

As I mentioned a week ago the lowest priced homes are selling fairly quickly and it is possible that the debt ceiling kerfuffle that impacted the world wide stock markets had a modest impact on local real estate too. The number of new listings is down and the inventory of homes on the market is fairly low which means that it may take buyers longer to find that perfect home so they should call me today so we can start looking. 

august2011stpre
august 2011 stpre

The numbers used to make this table were taken from the Regional Multiple Listing Service and are considered reliable but not guaranteed and they include single family residences, condos and townhouses. 

For more local numbers see Local Market Conditions and Home Prices or ask your Realtor. 

Median Home Prices – St. Paul, MN

 Our MLS (mulitple listing service) added some new functionality this past summer.  I used to have to download data onto an Excel spreadsheet so that I could make charts and graphs.  Now I can grab the data and create the chart without ever leaving the MLS.  Since most of the homes that are sold in St. Paul are listed in the MLS that gives me a lot of data to play with and I really do like data.

Keep in mind that real estate is local and since I specialize in St. Paul, Minnesota . . hence the name of the blog . . I made some charts to show home sales and median prices in St. Paul for the last five years.  Kind of a big picture look at local real estate.   A couple of years ago I wrote that no one would ring a bell when the prices hit bottom and we would never know that it happened until after the fact.  It happened in 2009 but it will happen again this year.  It may have happened already but prices tend to go down a little in the fall and winter.  For home buyers with jobs and money to buy a home this is a good time to buy but the inventory of homes on the market is low so it takes longer to find that perfect home.

I like to remind sellers that they can sell.  Homes sell every month . . honestly I am not making that up and I promise you home will sell much quicker if it is on the market. If you plan on buying another home start looking as soon as you have your home on the market.

St. Paul Home Sales and Prices
St. Paul Homes sales and Prices – 5 Year

2011 is not over yet and I will predict that the number of homes sales will be the same this year as it was for 2010.  When we look at the same chart for rental properties it shows that the median price dropped like a rock (technical term) but has been going yo since 2008.  Rents have been steadily increasing around the metro area and there are shortages of rental property in Minneapolis and I suspect the same will be true in St. Paul before the year is over. 

rentals
Rental Properties St. Paul, MN

The data used to create the charts was generated by the North Star MLS and is deemed reliable but is not guaranteed.

is there a new normal?

 Maybe there is a new normal in the housing market but there is still some of the hold normal too.  Here in the Twin Cities real estate sales are seasonal.  In the last couple of years the good old US government has tried to stimulate the housing market with tax incentives and well it didn’t do any good except it put a few kinks in  the normal seasonal home buying curve.  

This chart is from a report I created in book a showing.  It shows home viewing activity by month for the metro area.   There is a direct correlation between home viewing and home buying.  Buyers generally see homes before they buy and the more home viewings there are in a month the more home sales there are the next month.  It should be noted that the inventory of homes on the market is lower right now than it was in 2009 or 2010 which will affect the number of showings but should not impact the shape of the curve.  

This chart shows the seasonal home sales curve.  It looks like this year is a little more old normal than new normal. 

home showing chart
three year comparison of home showings 

Home buying activity is always the highest in the middle of the year and usually the lowest at the end of the year.  This year there are no special tax incentives for buying a home but prices have gone down and so have interest rates and it is starting to look a little more like 2009 which was more like the old normal than the new normal.