I am not sure how it happened bur I missed January which is weird because it is a big cold month and hard to miss. here are some statisitcs for January home sales in St. Paul, Minnesota.
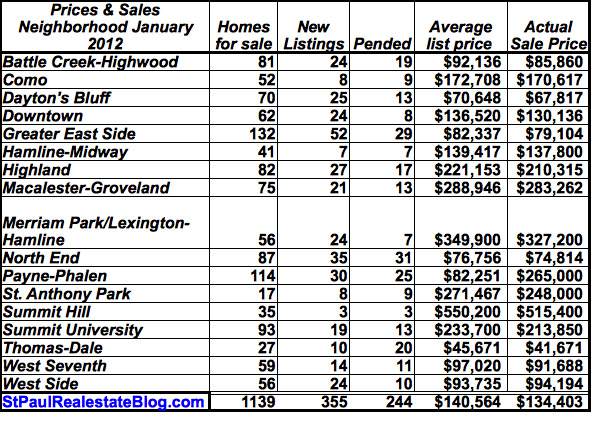
The data used to create the chart comes form the North Star MLS. The data is deemed reliable but not guaranteed. We will have numbers for February sometime next week.
Home prices are about what they were in January of 2011. The number of home sales is up from a year ago but about the same as it has been for the past three months. Real estate is local and these numbers may not reflect what it going on in your area.
The inventory of homes on the market continues to decline, there are about 25% fewer homes on the market today than there were a year ago. Prices are being held down by sluggish demand and the large number of below market value foreclosures on the market.
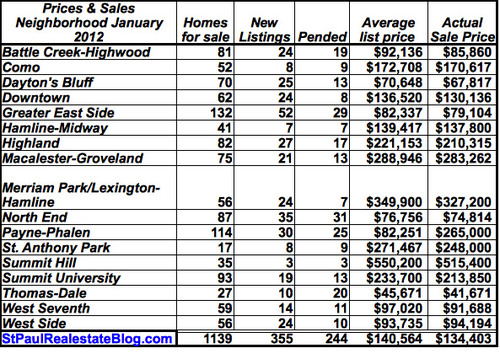
January 2012
For more reports and local real estate numbers check the Local Market Conditions & Home prices category.

Teresa, Interesting numbers. Some other things not noted here but that I found interesting when I looked at the numbers the RMLS put out was that the price range with the strongest sales was $150k homes and less which accommodated for 50% of all sales. One year ago there were almost 7,000 of these homes available, today there are only around 4,000.
These numbers come from the RMLS. I use the data to make the tables. The strongest sales in St. Paul were homes under 100K which make up more than 50% of St. Paul sales in january and yes the inventory of the lower priced homes is smaller than it was a year ago as is the inventory or homes in all categories.