Supply and demand drive the housing market. The supply of houses remains very low but up from an all-time low, which was a one-month supply in May of 2022. There is almost a two-month supply of homes for sale in St. Paul and a two-month supply in the 7 county metro area. The low supply will continue to drive up prices even though interest rates are over 7%.
Local Market Conditions & home prices
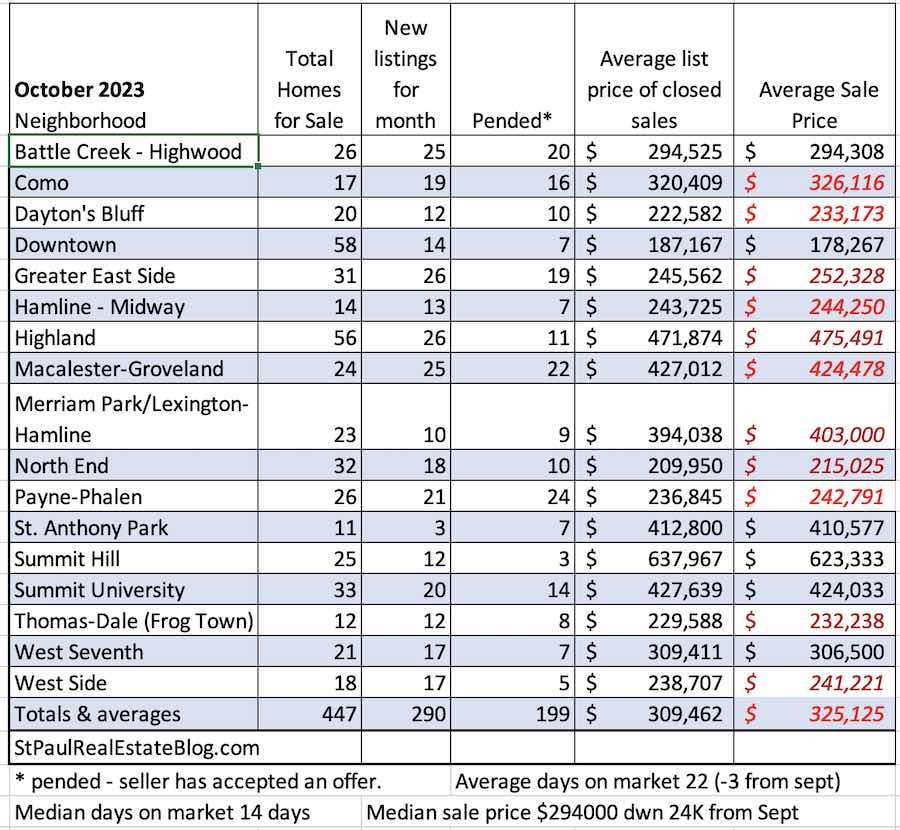
October 2023 home sales – St.Paul
It seems like the months are flying by. Here we are in November looking at October home sales. Most of the activity that resulted in sales in October actually happened in August and September. Interest rates seem to have peaked last week. We will likely see the impact of higher rates in the December numbers.
There are a few more homes for sale right now than there were last month and pending home sales went down. Prices are pretty stable. It takes less than 30 days to sell a house and the market favors sellers.
Here are home sales by St. Paul neighborhood for October 2023. These are single-family homes including condos. When the average sales price is higher than the average listed price that indicates that prices are or were going up. I think the numbers will look different in November because we are seeing a lot of price reductions. Buyers can and should negotiate.
Home sales down 22% from a year ago
I was reading some real estate news about how home sales are down this year as compared with last year. Real estate is local so I ran my own numbers using data from the MLS.
In Ramsey County in the last 55 days home sales were down 22% as compared with the same period last year (2022) and down 39% from the same period in 2021. 2020 and 2021 were not normal years. Home sales were up during those years which years. 2019 was a bit more normal and home sales were 33% higher in Ramsey County than they were during the same period this year.
In fact, I kept going back and home sales are lower than they were in 2011. So far prices are still rising which is very different from what happened during the housing market crash. Also, it is important to understand that the average number of days on the market is less than 30 in Ramsey County. In most cases, it takes less than a month to sell a house.
The reason for fewer sales is that fewer people want to put their house on the market and move because interest rates are above 7.5%. People may want to upgrade to a new house but they do not want to upgrade to a mortgage with much higher payments due to a much higher interest rate.
It would be nice if the Federal Reserve would stop raising interest rates. The slowing housing market will impact the rest of the economy if it hasn’t already.
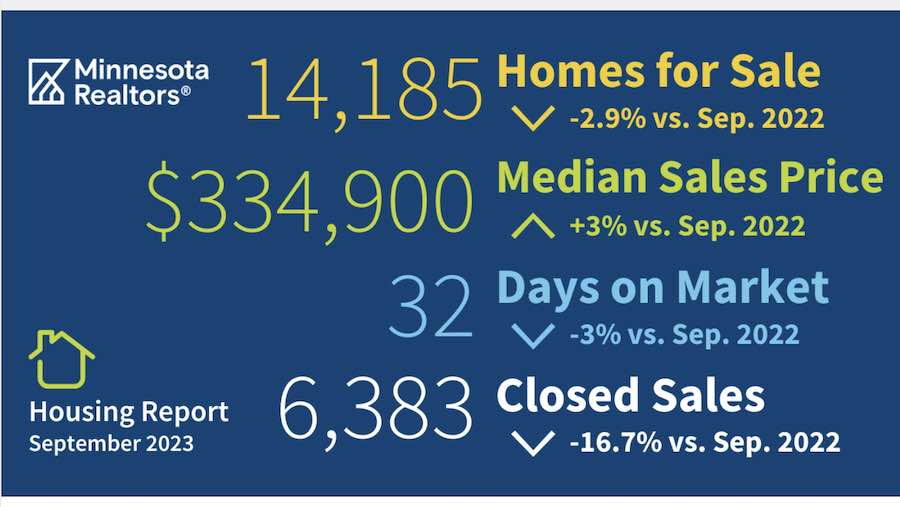
Minnesota Home sales – September 2023
This just in from Minnesota Realtors which is the state association of Realtors.
September 2023 Year-Over-Year Summary of Key Market Indicators:
- Closed sales: 6,383 (down 16.7%)
- Median sales price: $334,900 (up 3.0%)
- Average sales price: $389,658 (up 2.8%)
- New listings: 7,987 (down 5.5%)
- Pending sales: 5,535 (down 7.6%)
- Days on the market: 32 (down 3.0%)
- Homes for sale: 14,185 (down 2.9%)
Those prices keep rising due to a low supply and a high demand. Prices are not going up much but they are rising.
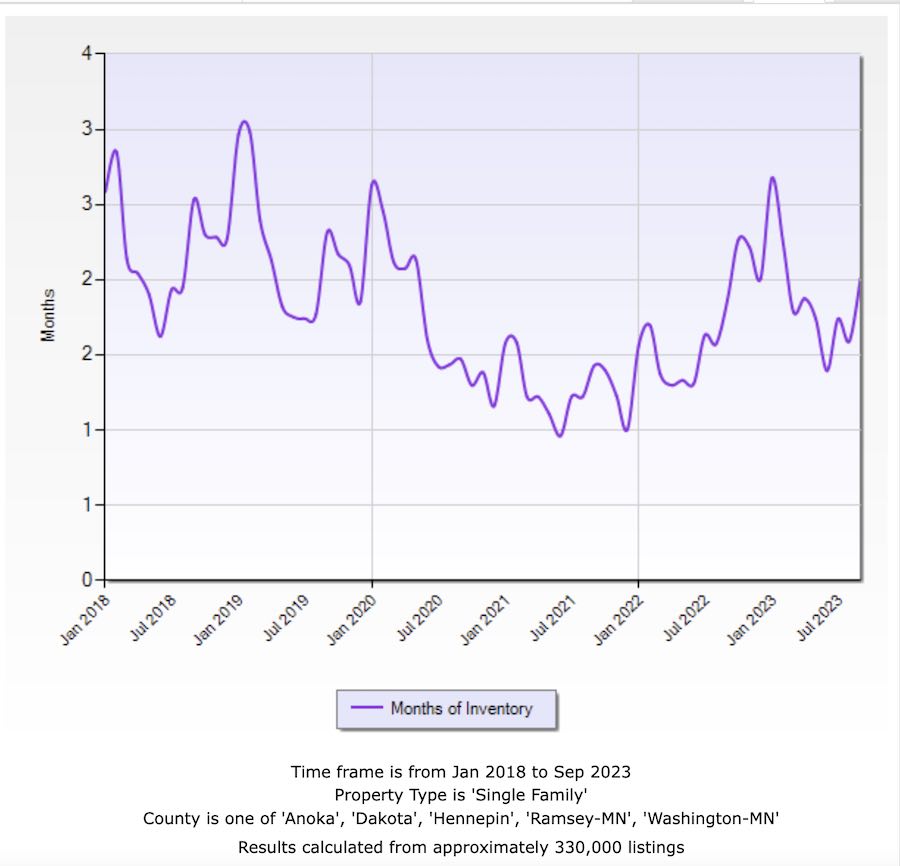
A two month housing supply in the metro
This Fall there is a two-month supply of houses on the market in the five-county metro area. With higher interest rates this may change but for now, the seller’s market isn’t losing its strength.
Homeowners with mortgages that have interest rates in the 1 to 3% range are likely to stay put for a while which means fewer houses on the market. At the same time, demand for houses remains high.
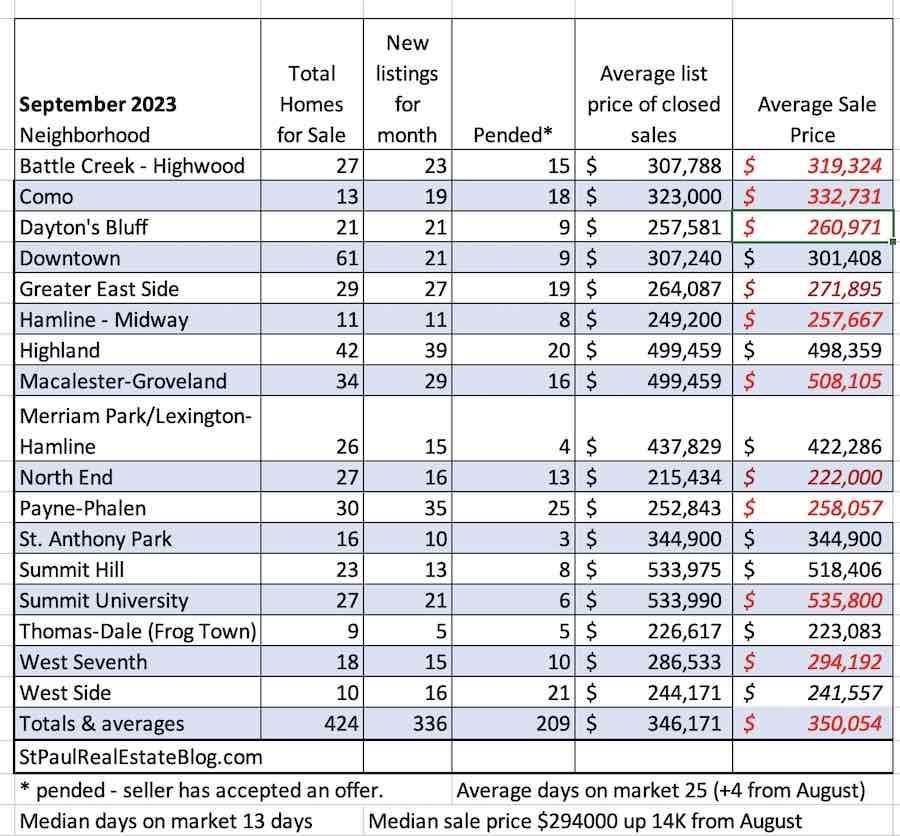
September 2023 Home sales – St. Paul, MN
September went by so fast that I almost missed it. If we make some comparisons between September 22 and September 23 most of the metrics are lower. Prices are higher.
There are fewer houses on the market in St. Paul and fewer new listings, pending sales, and fewer sales. Median sale prices are up and houses are selling quickly. The average number of days on the market is around 25 days.
The average sale price in September was more than the average list price which means prices are probably still rising.
All in all, I can only see good news for homeowners who want to sell.
Mortgage interest rates are still at 20-year highs. Rents may be softening a bit and there are opportunities to rent and to buy rental properties.
The table below shows home sales and prices by St. Paul neighborhood for the month of September. These numbers were extracted from the NothstarMLS which is a database of homes for sale. The data is deemed reliable but not guaranteed. There are few guarantees in life.
Yes, this is a great time to sell a house in St. Paul. Not such a great time to buy but people are buying.