This time I am comparing the buyer’s market of July 2011 with the seller’s market of last month (July 2022). I am doing this because I don’t think we all understand what a buyer’s market looks like.
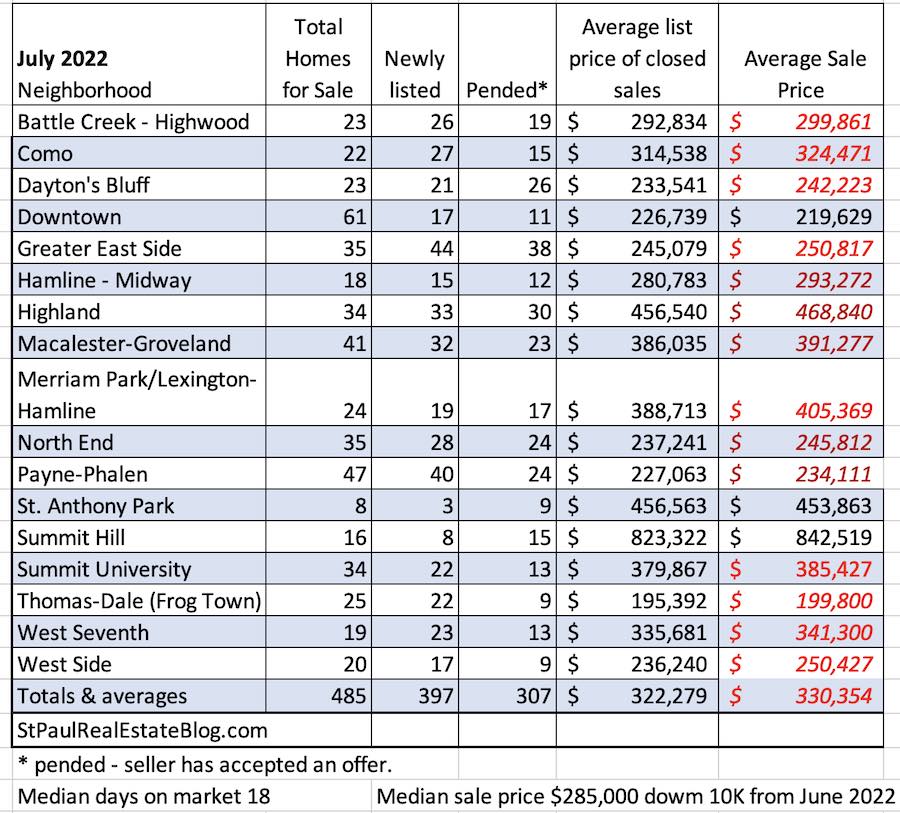
Right now we are experiencing a seller’s market in St. Paul and in the metro area. Home prices are rising. There are still more people who want to buy residential real estate than there are people who want to sell real estate.
Overall sale prices in St. Paul were higher than asking prices and on average it took 18 days to sell a house in July which is actually up part of a day from June.
The number of houses on the market is almost exactly the same as it was last July which is up slightly from June.
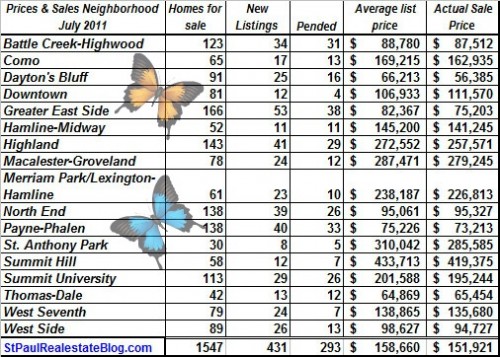
Here is a look at home sales and prices by St. Paul neighborhood in July 2011. This is what a buyer’s market looks like.
The numbers in both tables are from the NorthstarMLS which is deemed reliable but not guaranteed. The number represents a high percentage of the total number of single family homes sold in St. Paul.
2011 was the year that local home prices hit bottom.
For more local numbers check out Local Market Conditions & home prices
