Here are the December 2020 home sale numbers for St. Paul. For the first time in ten months, home sale prices were slightly lower on average than asking prices. In most years home sale prices are slightly lower in December than they are in other months. In other words, there is nothing to see here.
Pending home sales and total closed sales are up from December 2019 and it looks like overall home sales or the year are up around 14% from last year. It should be noted that 2019 home sales were the lowest in 5 years and the number of homes sold in 2020 is the highest for the same 5 years.
In several neighborhoods, on average sellers did get more than the asking price. Median home prices are up 7% from last December. Homes sold quickly even during the holidays and a raging pandemic with an average of 31 days on market, and a median of only 15 days on market.
I’ll have some year-end type numbers next week.
The inventory of homes for sale remains at historic lows. The demand for housing continues to drive up prices. January 2021 promises to be a great month for local home sellers.
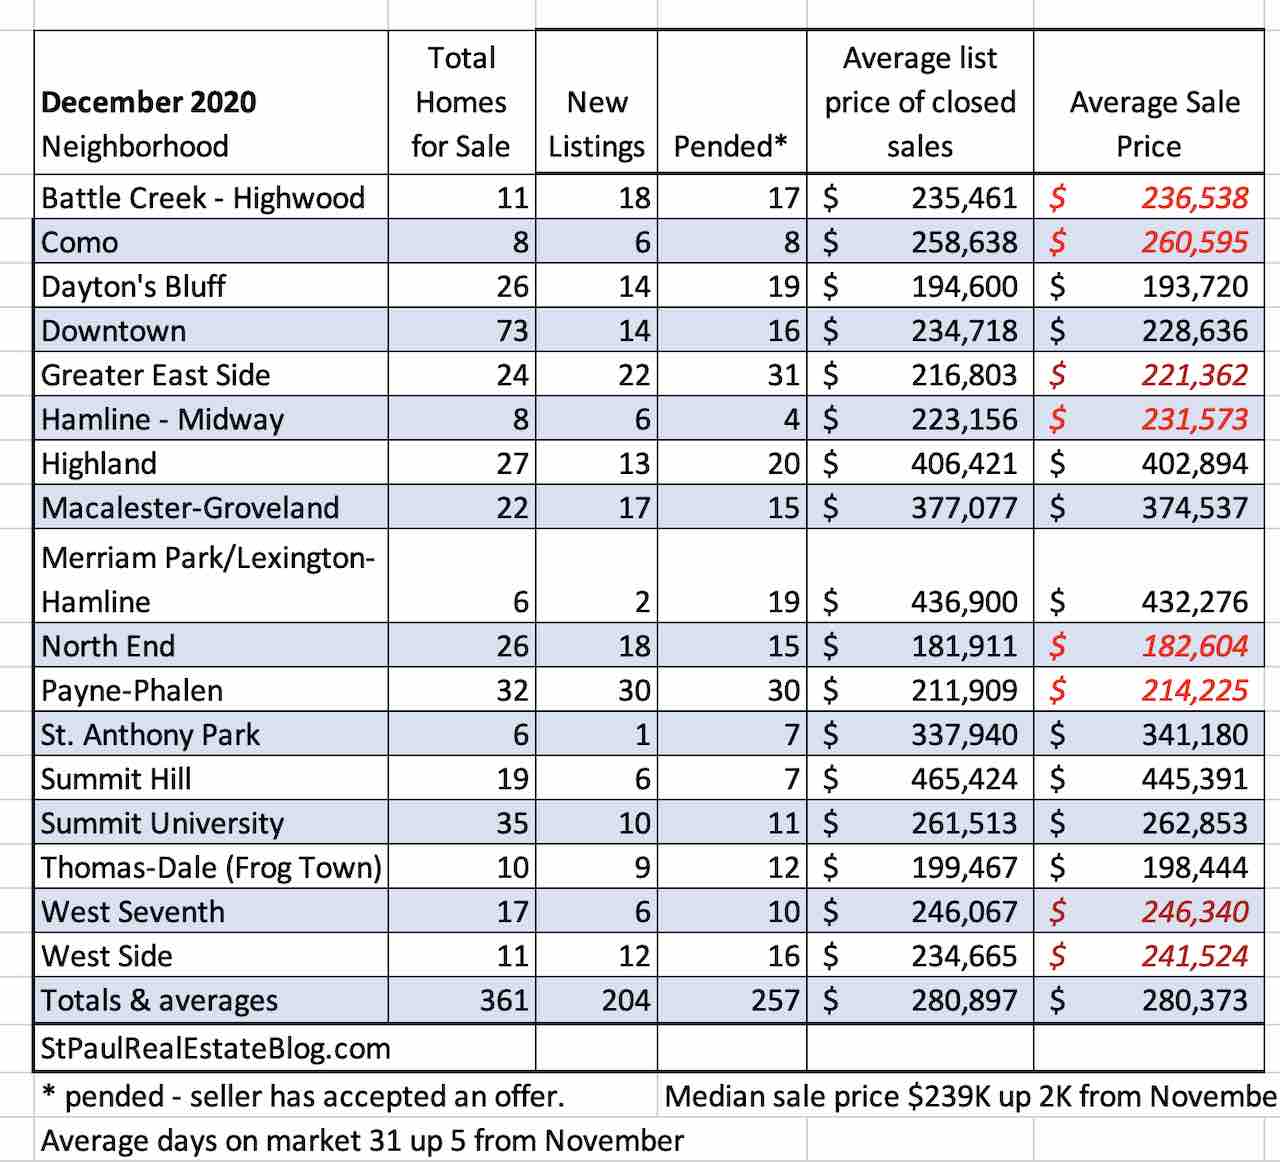
The data used to make the chart was extracted from the NorthstarMLS which is deemed reliable but is not guaranteed. The data includes a high percentage of single-family homes, condos, and townhouses that were sold within the city limits during the month ending 12/31/2020.
If you would like to know how much your house will sell for and how long it will take to sell please contact me for a no-obligation and always free consultation.
For more local home sales numbers and assorted statistics, please see Local market conditions and home prices
