I like numbers and data. Every morning I look at this chart that is right in the NorthStar MLS. The MLS is the multiple listing service and all homes that are listed by a Realtor® are put in the MLS making it the best source of numbers for home sales because it is owned by Realtor® and data integrity is taken very seriously.
Here is the chart I pulled up yesterday. It is for all St. Paul, MN only.
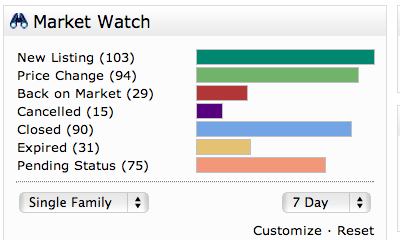
By looking at it I get a snap shot of what is happening in the local housing market. Pending listings are homes that have offers on them that have been accepted by the seller but have no yet closed so we don’t consider them sold. In the last seven days 103 homes have gone on the market and during the same seven days buyers have made offers on 75 homes.
The inventory is moving. If I were to speculate some of the 15 cancelled listings are due to sellers giving up after having their homes on the market for a time. Some will re-list in the spring and will eventually show up in the “back on market” category.
Expired means that the contract between the Realtor and the seller ran out. Some will re-list with a different agent and others will take their home off the market. The 90 home sales that closed in the last seven days in most cases received offers in the last 30 to 60 days which is one of the reasons we look at pending sales to help gauge current market conditions.
Inventory levels have ticked up a bit but if I subtract out the homes that have offers on them but are not in the “pending” status the inventory of homes on the market is almost at an all time low.
Home prices have ticked up a bit but don’t get too excited. they are up from the all time low that we hit last year in St. Paul and seem to be about what they were a decade ago which of course is good news for buyers but not such good news for sellers . . unless of course they are buyers too.
