Real estate is local just like me and I have been downloaded data from our local MLS into spreadsheets for years now to get data on St. Paul home sales and prices. The MLS is the big data base that has all of the homes for sale by Realtors which does represent most of the homes sold in the area. We keep track of listing prices, sales prices, days on market and much more. I love data except when it is distorted to make for a better news story.
The data used to create the chart comes from the North Star MLS. The data is deemed reliable but not guaranteed. . . .which is alright because there are no guarantees in life. These numbers are for single family homes which includes condos in St. Paul, Minnesota for the month ending April 30, 2012.
The median home price went up by another grand for the third month in a row and now sits at 114,500 which is way down from the peak but looks better than the two digit numbers we saw at the end of 2011.
The average list price is almost exactly the same as it was last month but average sale prices went up which means that sellers got closer to their asking price last month.
The number of homes that sold and closed is up from From March which was down from February. . . which I will predict was the high for the year.
I would describe the local housing market as fairly stable and sputtering a long and I would describe April numbers as ‘Meh’ but they are a little more positive than negative.
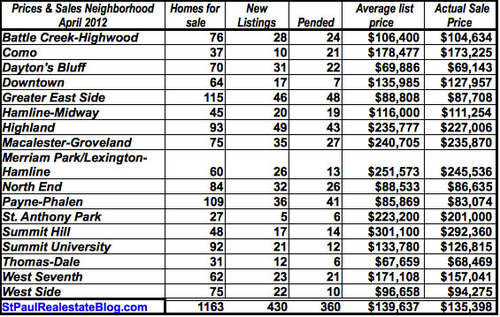
april2012

The inventory of homes on the market is slightly lower than last month.
For more local numbers please see Local Market Conditions & home prices
