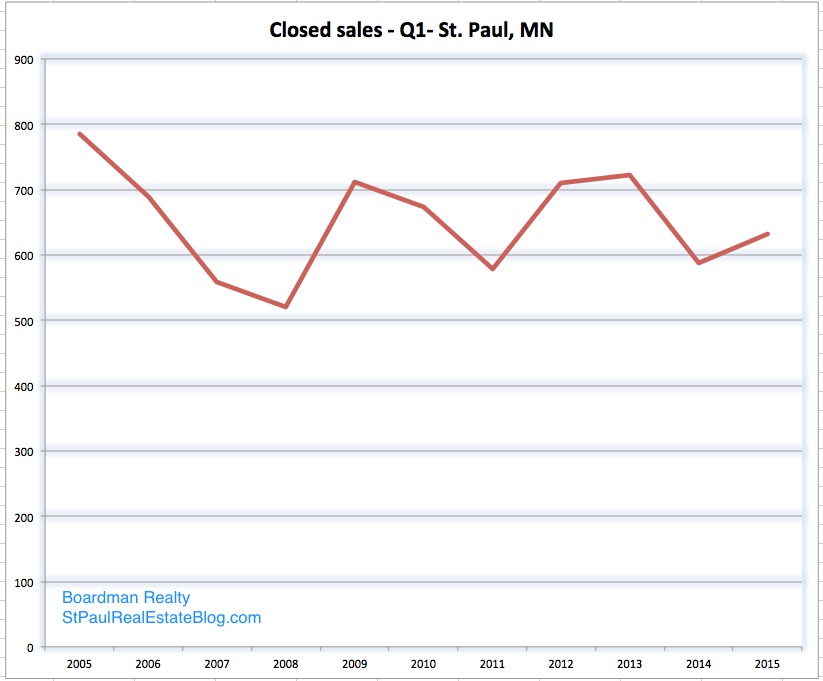
Yes it is true that home sales in 2015 for the first quarter are up significantly from the first quarter of 2008 which is the year some consider to be the last year before the housing market crash. First quarter home sales were down significantly in 2015 from the peak years 2005 and 2006.
I have been reading the real estate numbers for the first quarter of 2015 and the accompanying media blasts and have decided that they are overly optimistic. Maybe I just don’t understand math but I honestly believe that the lack of homes on the market is holding back the still recovering real estate market and that yes we are in a strong sellers market but I think the Realtor® associations are painting a picture that is a little rosier than reality, at least for Saint Paul.
A smaller number of homes on the market is causing prices to move upward, which is nice for homeowners but is it good for home buyers? Is it sustainable? A healthier housing market would be one that is a bit more balanced between buyers and sellers which can not happen until because there are not enough sellers.
The numbers on the chart were extracted from the NorthstarMLS which has sales data that is deemed reliable but not guaranteed. I put the numbers in an MS Excel spreadsheet to create the graph I have published. These are local numbers for the city of Saint Paul Minnesota and represent the closed sales of single family homes during the first quarter of every year for the last ten years including townhouses and condominiums.
The data does not include rental or commercial property. These are actual closed home sales. Maybe that is a different way of looking at it but I think the number is important.
As always I am happy to show my math if it will help.
