July is over. We had a busy month with new listings and new buyer clients too. It is all a blur to me. The numbers show that there are more homes on the market than there were at the beginning of July. In many most neighborhoods and in the city as a whole the average sale price in July was higher than the average listing price.
The average days on market were less than 25 in July without a lot of variation between lower priced homes and higher priced homes.
Prices, the number of new listings and the number of pending listings were lower in July than in June. Traditionally July prices and new listings are lower than they are in June so I’ll call it a seasonal variation.
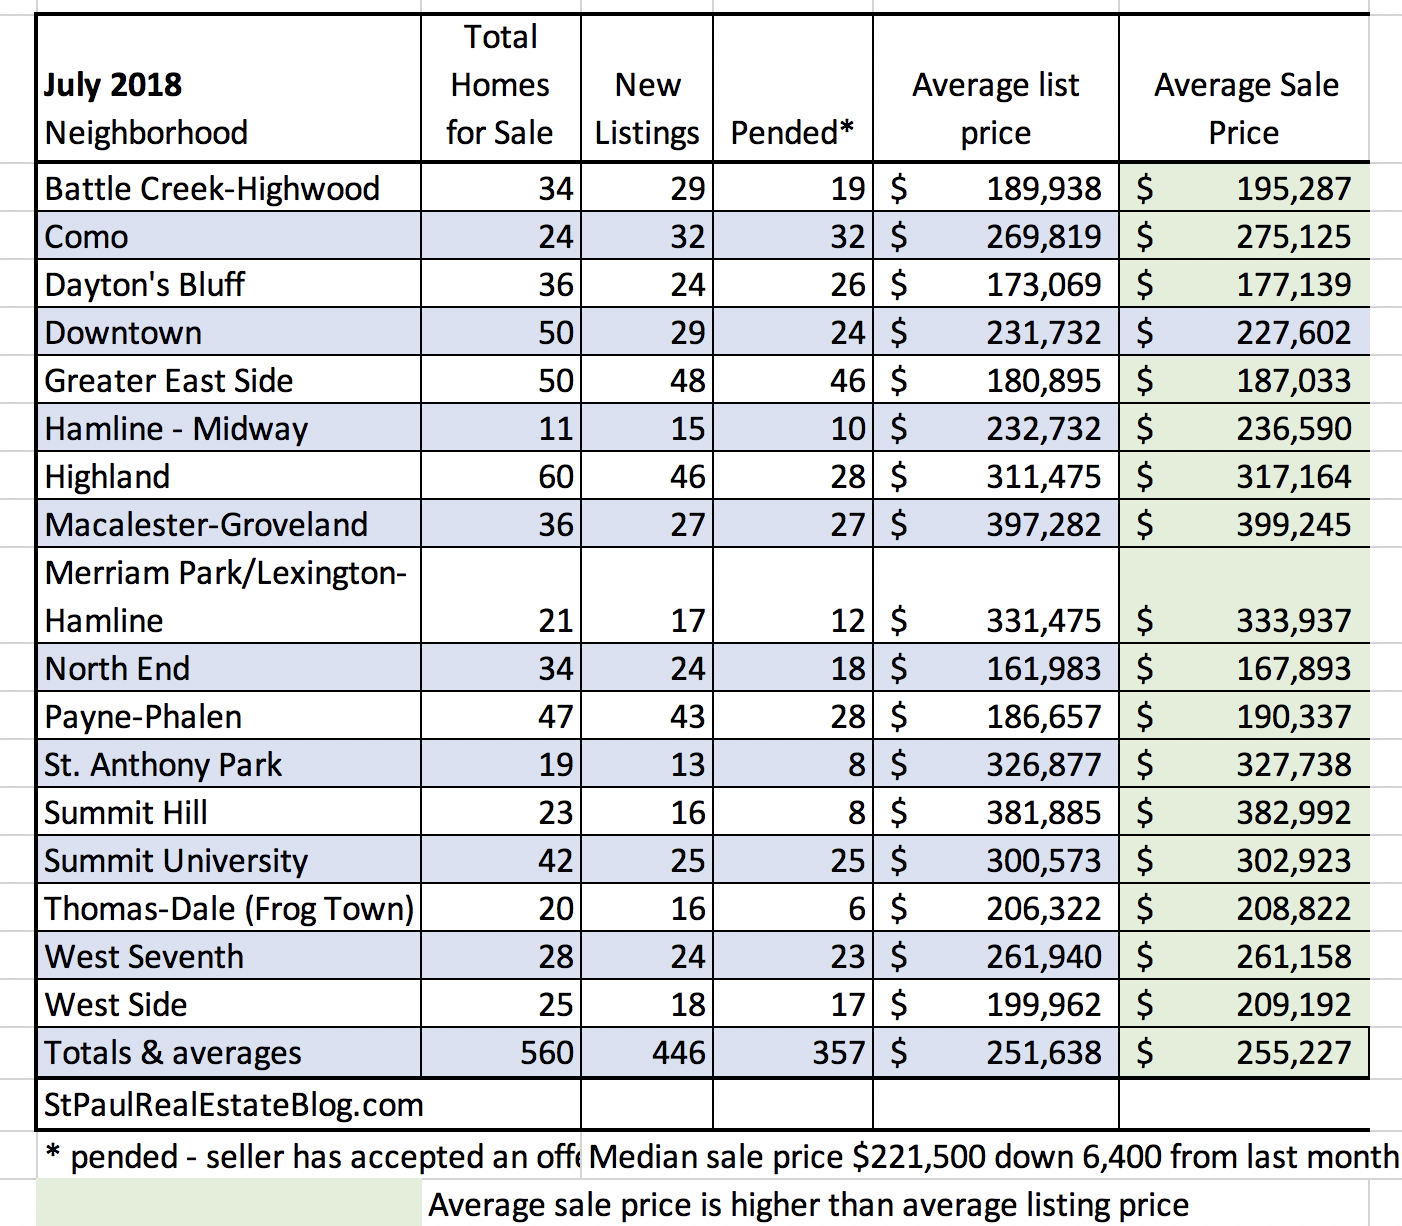
The numbers used to make the chart above were extracted from the Northstar MLS and imported into an MS Excel spreadsheet where it is gently sorted and never stirred. The data is deemed reliable but not guaranteed. There are few guarantees in life and a lot of broken promises too.
If you would like to sell your home please contact me. I do have buyers looking for small homes and larger homes and condos too.
