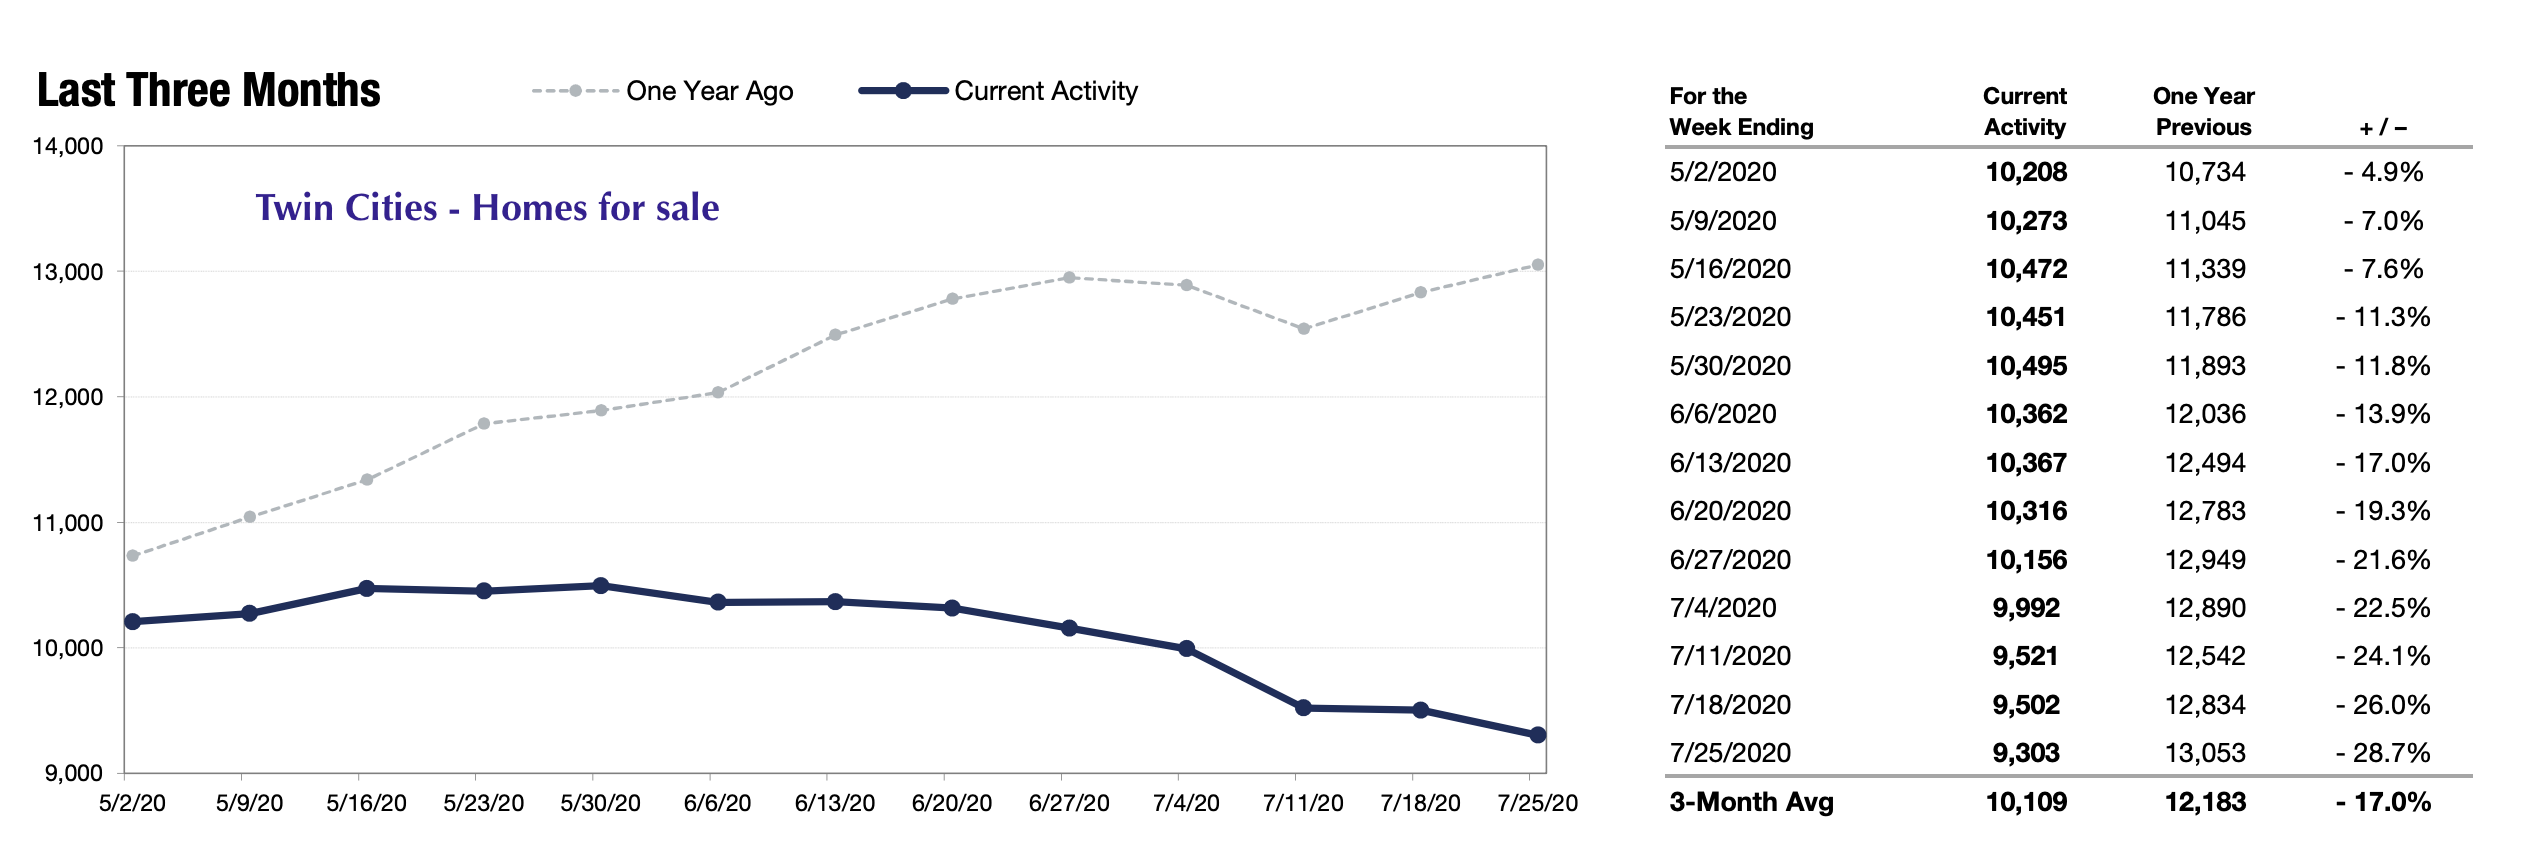
I am not even sure what this chart means but it shows a decrease in the number of new listings and we are seeing a decrease in the number of homes on the market as buyer activity and interest remains high.
This is part of a strong trend that we have been seeing for several years but it seems to be getting stronger this year. Maybe the pandemic?