In 2011 it may have taken 77 days to sell the same home that sold in 30 days in 2018.
Some homes sell in a day, while other homes will stay on the market for months. How a home is presented and priced makes a difference.
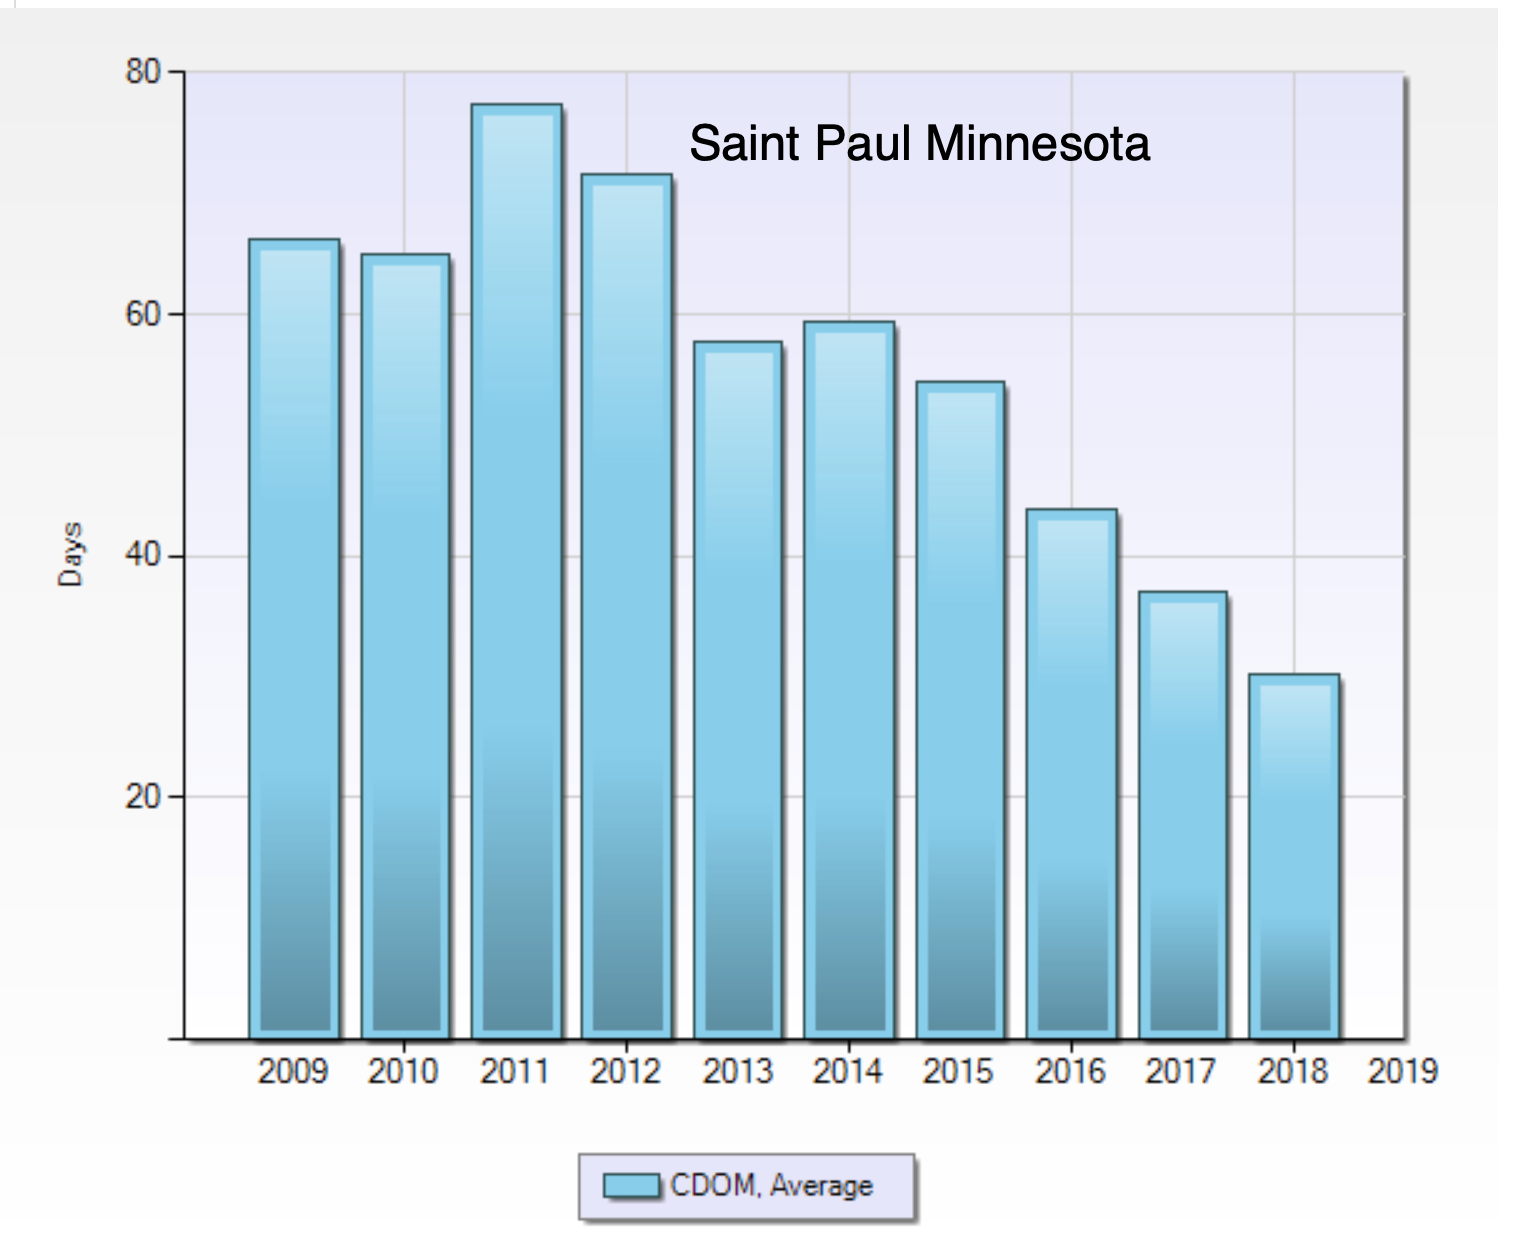
CDOM in the chart stands for “cumulative days on market”, that includes the entire time a home was on the market before it sold . . . which gets complicated but I like to use the number as a guide and I can drill down and look at the numbers for various neighborhoods and price points.
The chart was made using data from the Northstar MLS which is deemed reliable but not guaranteed.
