October Home sales

 It is Monday which is a perfect day for looking at some real estate numbers by neighborhood for St. Paul, Minnesota, for the month of October 2013. 

I really do love numbers.  The numbers used to make the table came from the Northstar MLS which is deemed reliable but not guaranteed.

october numbers
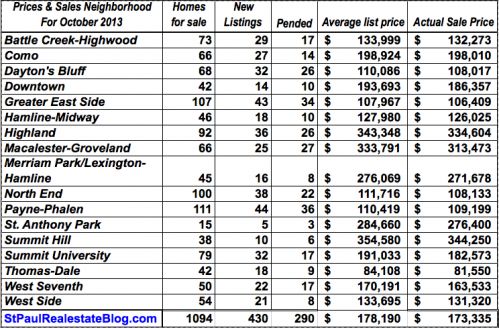
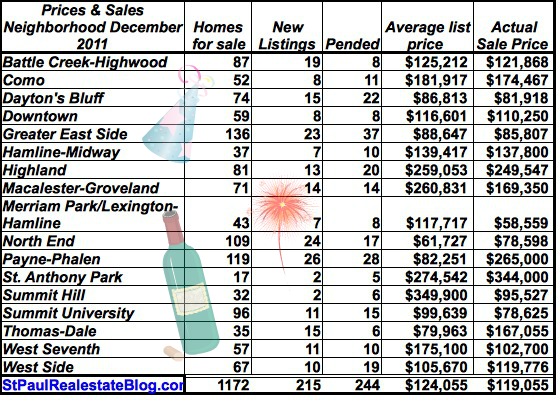
October numbers – click on table to enlarge

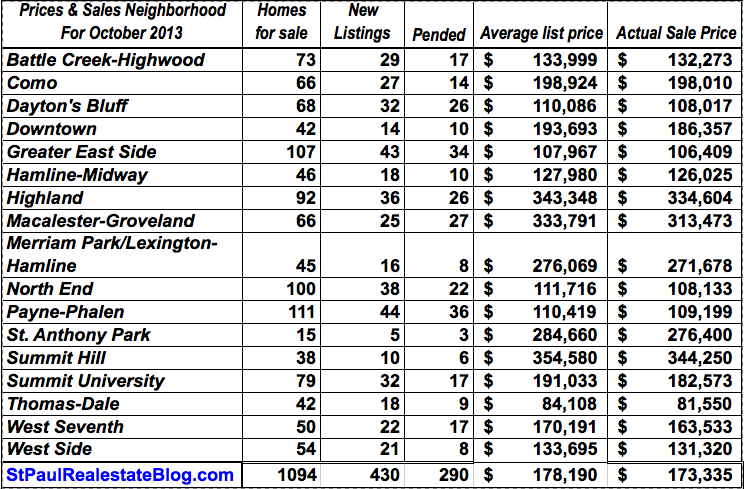
After a couple of months of small increases in the inventory of homes for sale we saw a small decrease in October which is a normal seasonal kind of thing. Prices are still strong but peaked for the year last summer.  Home sales are down from last month which again is part of the normal cycle.  

The number of new listings is down from last month but higher than I had expected.  Perhaps some sellers are taking advantage of the strong market and selling now instead of waiting until the spring.

For more local numbers like these please see Local market Conditions and Home Prices.

St. Paul by bike

 Here are some of the sites from a recent bike ride.  I took the Samuel Morgan trail from UpperLanding Park to the Bruce Vento trail.  I crossed Warner road on the footbridge and went through Indian Mounds Park to get onto the Bruce Vento Trail.  I went a little over 11 miles and it took more than an hour and a half because I stopped to take pictures along the way.

bikeride
Bike Ride Map using the Runtastic App
IMG 3144t edited 1 w
Indian Mounds Park – scenic overlook 
abandonded w
On Commerce street 

The second picture was taken from the Bruce vento trail.  There are acres of parkland along the trail that has been converted to nature preserve.  It is beautiful but you can’t see much of it from your car. 

National bike to school day

whiteman
white man

 Today is national bike to school day so I am going to give St. Paulites some insider tips.   If you bike in downtown St. Paul watch out for the horse droppings in the lower town area.   There are miles and miles of bike paths through out the city.  You can now find many or most of them using Google maps.  Just click the little bike icon when getting directions from one place to another.  It is best to use bike paths when ever possible.  Cars do not understand the white lite with the little man on it or the share the road signs on the roads without bike lanes. 

The city of St. paul web site also has maps of the local bike paths.  I am not sure how to use them and as always and if you are reading this after May 2012 the link will have moved because the city has a full time employee that does nothing but move web pages so that the links get broken.  

Happy biking!


St. Paul Homes Prices & sales by neighborhood

 It is Monday and I have some real estate numbers for St. Paul Minnesota because real estate is local and I like numbers.  

The numbers used to make the chart came from the Northstar MLS and are deemed reliable but not guaranteed.  I did not take any of the numbers I just borrowed them.

December is the slowest month of the year for home sales and prices are usually the lowest of the year.  Median prices in St. Paul were $104,500 for December 2011.  

For the first time since in many years but I do not know how many there was more buying going on in our market than selling.  The number of pending sales is higher than the number of homes that were listed.  This is great news for home sellers.  

december2011
December 2011

The inventory of homes on the market is very low and buyers are having a hard time finding that perfect home.  I have been watching every day for new listings for my buyers which is something I have not had to do in years.

I anticipate an increase in homes on the market and an increase in buying activity because we almost always see more activity in January than in December.  

For more numbers like these please see local numbers and market conditions.

Median Home Prices – St. Paul, MN

 Our MLS (mulitple listing service) added some new functionality this past summer.  I used to have to download data onto an Excel spreadsheet so that I could make charts and graphs.  Now I can grab the data and create the chart without ever leaving the MLS.  Since most of the homes that are sold in St. Paul are listed in the MLS that gives me a lot of data to play with and I really do like data.

Keep in mind that real estate is local and since I specialize in St. Paul, Minnesota . . hence the name of the blog . . I made some charts to show home sales and median prices in St. Paul for the last five years.  Kind of a big picture look at local real estate.   A couple of years ago I wrote that no one would ring a bell when the prices hit bottom and we would never know that it happened until after the fact.  It happened in 2009 but it will happen again this year.  It may have happened already but prices tend to go down a little in the fall and winter.  For home buyers with jobs and money to buy a home this is a good time to buy but the inventory of homes on the market is low so it takes longer to find that perfect home.

I like to remind sellers that they can sell.  Homes sell every month . . honestly I am not making that up and I promise you home will sell much quicker if it is on the market. If you plan on buying another home start looking as soon as you have your home on the market.

St. Paul Home Sales and Prices
St. Paul Homes sales and Prices – 5 Year

2011 is not over yet and I will predict that the number of homes sales will be the same this year as it was for 2010.  When we look at the same chart for rental properties it shows that the median price dropped like a rock (technical term) but has been going yo since 2008.  Rents have been steadily increasing around the metro area and there are shortages of rental property in Minneapolis and I suspect the same will be true in St. Paul before the year is over. 

rentals
Rental Properties St. Paul, MN

The data used to create the charts was generated by the North Star MLS and is deemed reliable but is not guaranteed.

Home Prices by Neighborhood

april2011chart
April 2011 St. Paul, MN

The news media is all over the idea of a double dip recession and they are looking at average housing prices.  Home prices in St. Paul are down slightly.  They are down from last year but last April they were slightly inflated because of the home buyer tax credits.  Home prices are higher this April than they were in the April of 2009. 

Home sales remain sluggish and the number of homes on the market is slowly climbing as more foreclosures hit the market.  There is plenty of room for optimism  but not in the housing market.  

The chart above was made from numbers from our local MLS for St. Paul, Minnesota for the month of April 2011. The data is deemed reliable but not guaranteed but there are few guarantees in life.

For more local numbers please see Local Market Conditions and Home Prices and remember that real estate is local.