Real local numbers now

graph
1st quarter Home Sales St. Paul, MN

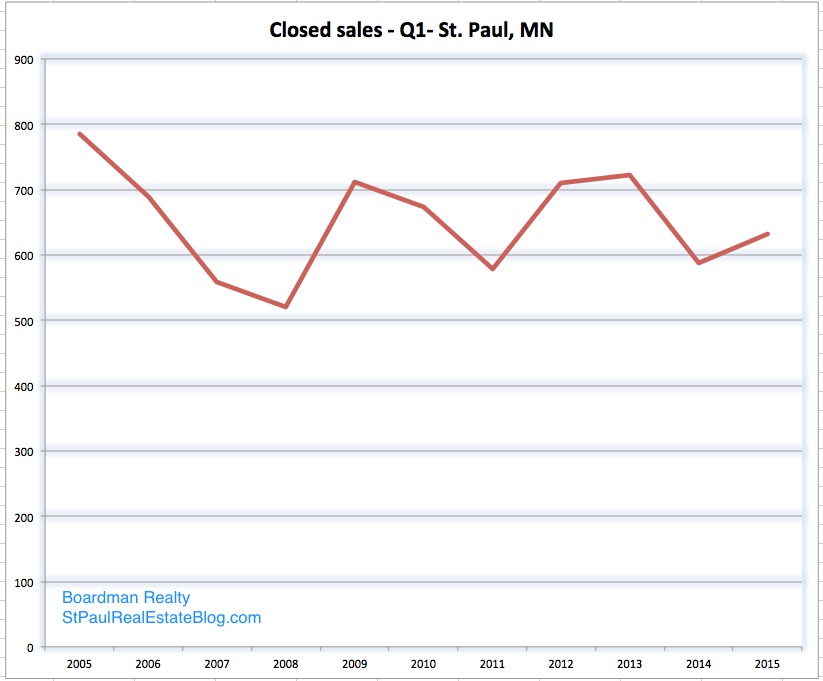
Yes it is true that home sales in 2015 for the first quarter are up significantly from the first quarter of 2008 which is the year some consider to be the last year before the housing market crash. First quarter home sales were down significantly in 2015 from the peak years 2005 and 2006.

I have been reading the real estate numbers for the first quarter of 2015 and the accompanying media blasts and have decided that they are overly optimistic. Maybe I just don’t understand math but I honestly believe that the lack of homes on the market is holding back the still recovering real estate market and that yes we are in a strong sellers market but I think the Realtor® associations are painting a picture that is a little rosier than reality, at least for Saint Paul.

A smaller number of homes on the market is causing prices to move upward, which is nice for homeowners but is it good for home buyers? Is it sustainable? A healthier housing market would be one that is a bit more balanced between buyers and sellers which can not happen until because there are not enough sellers.

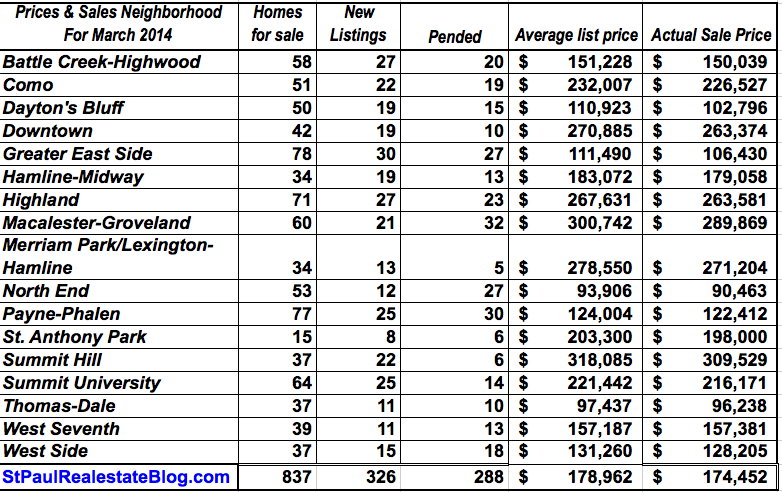
The numbers on the chart were extracted from the NorthstarMLS which has sales data that is deemed reliable but not guaranteed. I put the numbers in an MS Excel spreadsheet to create the graph I have published. These are local numbers for the city of Saint Paul Minnesota and represent the closed sales of single family homes during the first quarter of every year for the last ten years including townhouses and condominiums.

The data does not include rental or commercial property. These are actual closed home sales. Maybe that is a different way of looking at it but I think the number is important.

As always I am happy to show my math if it will help.

St. Paul Home sales and Prices by Neighborhood

Numbers are a great way to start the week and these numbers represent home sales in the city of St. Paul, MN by neighborhood for the Month of March 2014.  Even though temperatures were below average home sales and prices were about what I would have expected for the month. Generally as we head into spring the number of home sales increases city wide and the prices go up. I noticed in the Macalester-Groveland neighborhood, and the Payne -Phalen neighborhood  the number of homes that went pending is greater than the number that were put on the market.

The median home sale price for St Paul was around 144K in January, and it was 153,500 for March. The average home sale price is also up by about 4% since January.

Table
March 2014 numbers

Even though 837 homes are currently for sale in St. Paul many of them have contingent offers on them leaving about 652 with no offers.

The numbers used to make this table came from the Regional Multiple Listing Service (RMLS) which is deemed reliable but not guaranteed.  There is no better source for local home sale data.  No numbers were harmed in the creation of this table.  They were instead imported into a MS Xcel spreadsheet where they were carefully sorted, totaled and averaged. 

For more local data for home sales in St. Paul, MN please see the Local Market Conditions and Home Prices category.

Sellers you will not get your asking price

 Buyers are never sure how much to offer on a home.  I like to figure out what the value of the home is and suggest that they base their offer on that. 

Most sellers know that they won’t get their asking price.  I made this little chart of list prices vs. asking price from data in out MLS for the St. Paul homes for the last few years.  The MLS has data for most of the homes bought and sold in these parts and the data is deemed reliable but not guaranteed. 

Buyers are very cautious these days and so are lenders and appraisers.  No one wants to pay too much for a home.

ChartImg
List price vs sale price St. Paul, MN
NorthstarMLS Matrix 20120521 154757 jpg
Actual numbers for the bar chart
 

March 2012 homes sales

The data used to create the chart comes form the North Star MLS. The data is deemed reliable but not guaranteed. . . .which is alright because there are no guarantees in life. These numbers are for single family homes which includes condos in St. Paul, Minnesota for the month ending March 31, 2012.

The average home sale price is up as is the median which is now a six digit number at $113,500 which is up from last month when it was a five digit number but I can’t find the number at the moment so just trust me.

Untitled 1
March 2012

The inventory of homes on the market remains low.  The only surprise in this data is that the number of pending sales is down from last month and I would have expected them to be up because generally March is a better month for home sales than february is.  The number could mean that the spring market has already lost it’s spring but one months worth of data usually doesn’t mean all that much.  

Pending sales are up from the same time last year which is a good thing because we hit a new bottom last year and it wouldn’t be the bottom if the numbers were lower this year.  Average an median prices are up from last month and up slightly  from a year ago.

Remember that real estate is local and if you are looking for more local numbers please check local market conditions and home prices. 

St. Paul Home Prices and sales by neighborhood

 I am not sure how it happened bur I missed January which is weird because it is a big cold month and hard to miss.  here are some statisitcs for January home sales in St. Paul, Minnesota.  

The data used to create the chart comes form the North Star MLS.  The data is deemed reliable but not guaranteed.   We will have numbers for February sometime next week.

Home prices are about what they were in January of 2011.  The number of home sales is up from a year ago but about the same as it has been for the past three months.  Real estate is local and these numbers may not reflect what it going on in your area.

The inventory of homes on the market continues to decline, there are about 25% fewer homes on the market today than there were a year ago.  Prices are being held down by sluggish demand and the large number of below market value foreclosures on the market.  

jan2012
January 2012

For more reports and local real estate numbers check the Local Market Conditions & Home prices category. 

Prices & Homes Sales by St. Paul Neighborhood

Here are the August numbers for St. Paul home sales.  The good news people like to compare this past August with August of 2010 which was one of the worst months since the housing crash began.  We had a slow summer last year after the tax credits expired because when they were in effect all they did was encourage people who were ready to purchase a home to do it at the beginning of the year.  

Home sales this August are up slightly from July which is fairly unusual and a good sign . . I think and up by almost 30% from August of 2010 which doesn’t mean much but it is the good news everyone is looking for.  Home prices went down slightly from what they were in July.  The Median home price in St. Paul for August 2011 was $102,448.  

As I mentioned a week ago the lowest priced homes are selling fairly quickly and it is possible that the debt ceiling kerfuffle that impacted the world wide stock markets had a modest impact on local real estate too. The number of new listings is down and the inventory of homes on the market is fairly low which means that it may take buyers longer to find that perfect home so they should call me today so we can start looking. 

august2011stpre
august 2011 stpre

The numbers used to make this table were taken from the Regional Multiple Listing Service and are considered reliable but not guaranteed and they include single family residences, condos and townhouses. 

For more local numbers see Local Market Conditions and Home Prices or ask your Realtor.