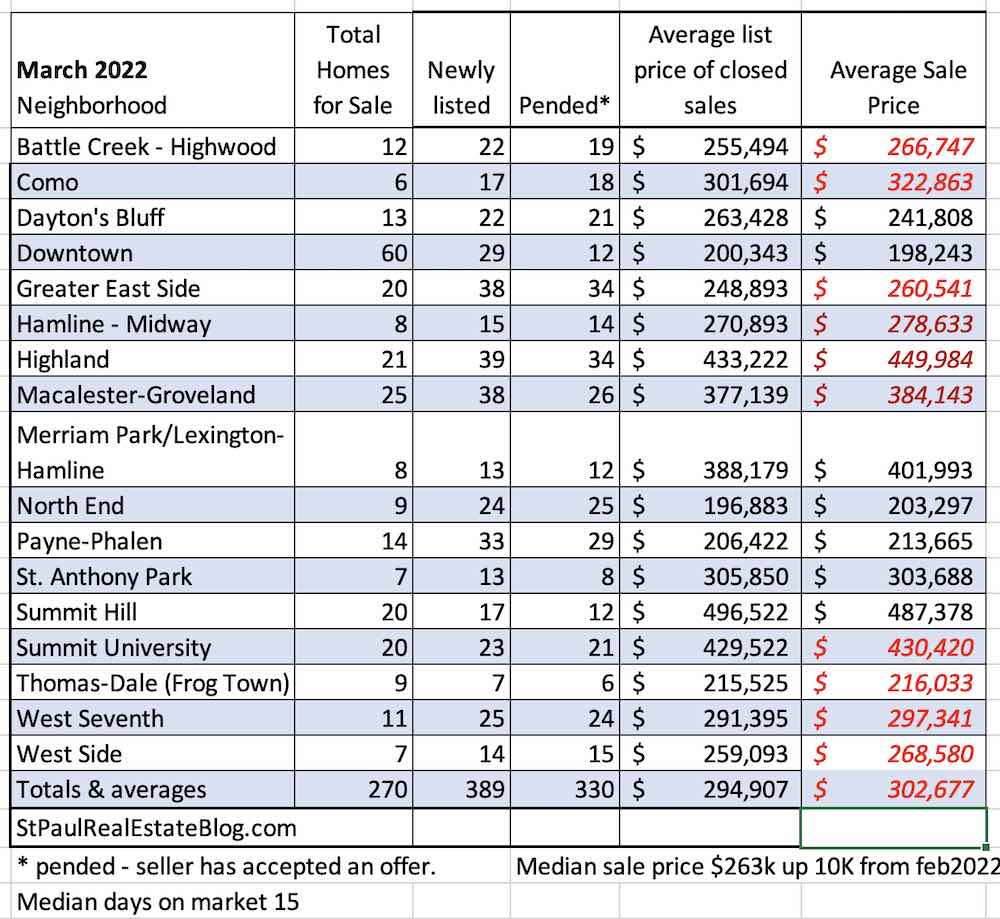
Here is a recap of March 2022. Home sales and prices in St. Paul by neighborhood. The numbers include all single-family homes in St. Paul. Townhouses and condos are included, and rental properties are not. The data was extracted from the. NorthStarMLS and represent most of the homes sold in St. Paul during the month of March.
Median days on market have gone down since last month. The average is 36 days. On average sale prices are slightly higher than asking prices but it is starting to shift a bit. It is the first sign I have seen in a while that the rise in housing prices might be slowing. Interest rates may be having an impact.
Pending sales and sales are down from last March. As I have been saying every month for the last few years we are experiencing a strong seller’s market caused by high demand for housing or a shortage of houses that are for sale.
I’ll have some numbers for the rest of Minnesota next week.
